POLS 1140
Political Knowledge and Information
Updated Apr 13, 2026
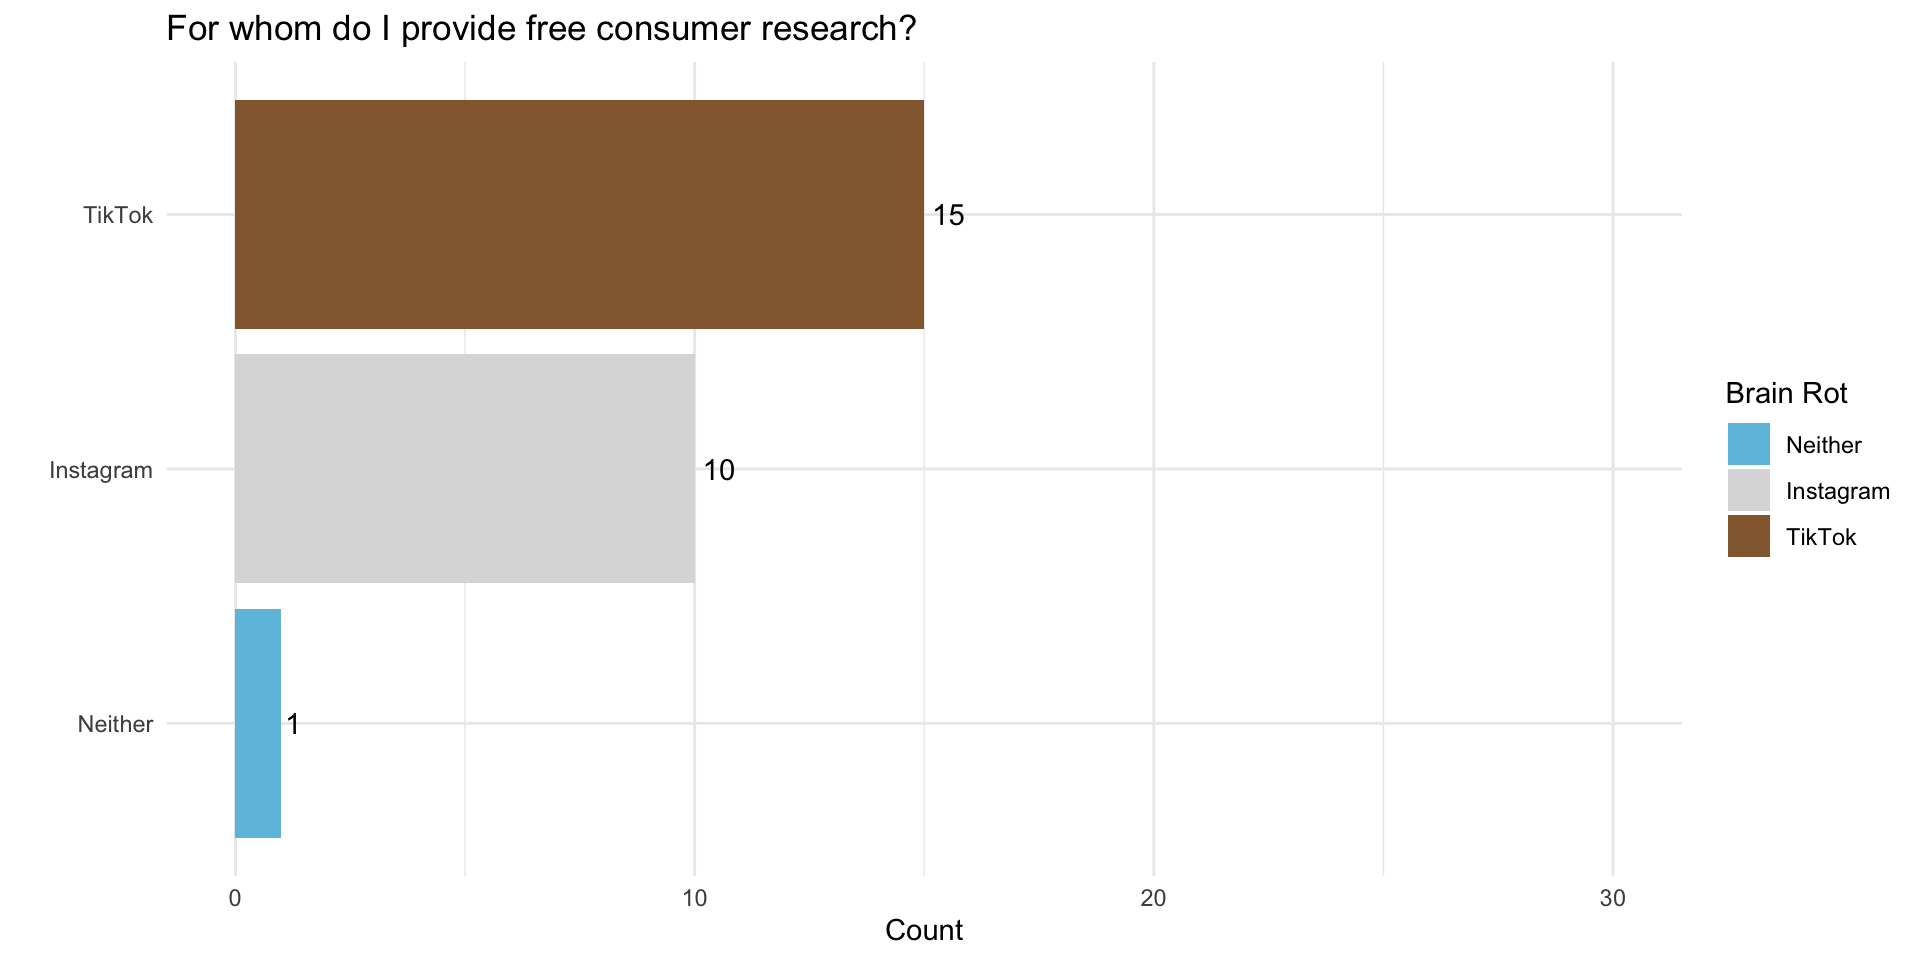
Instagram or TikTok?
What does the public know?
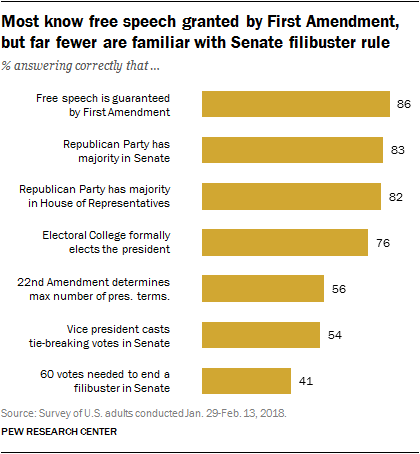
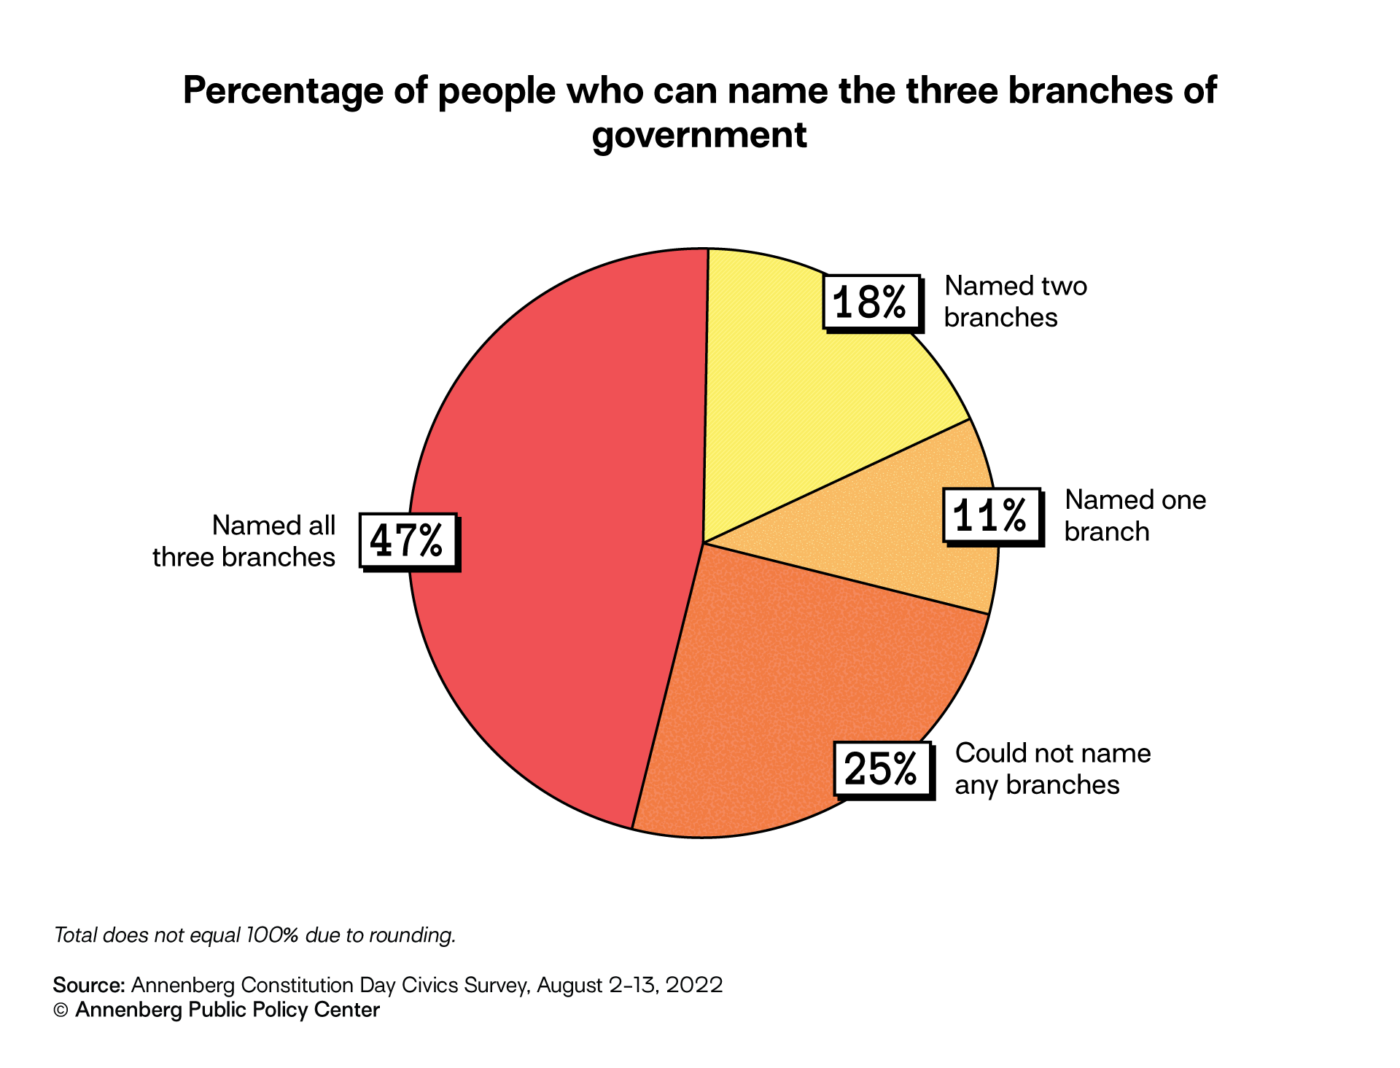
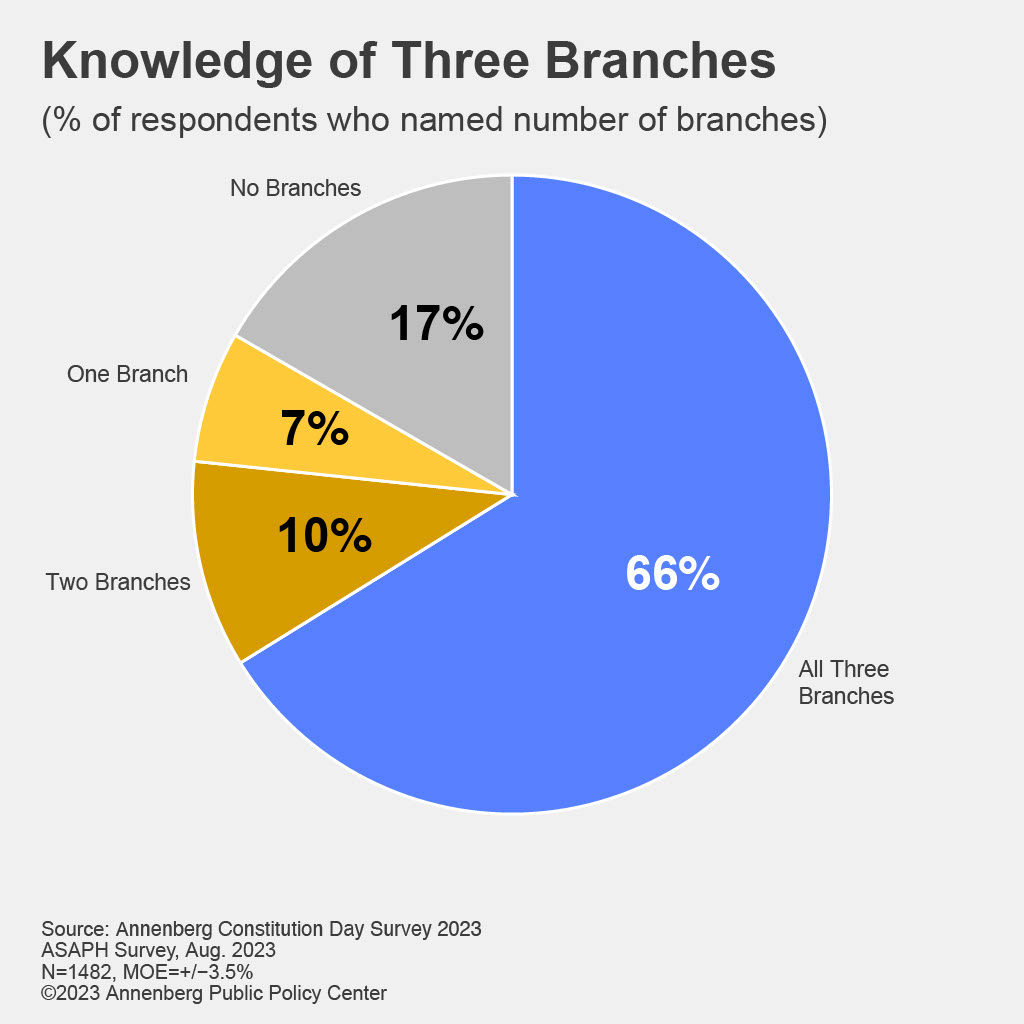
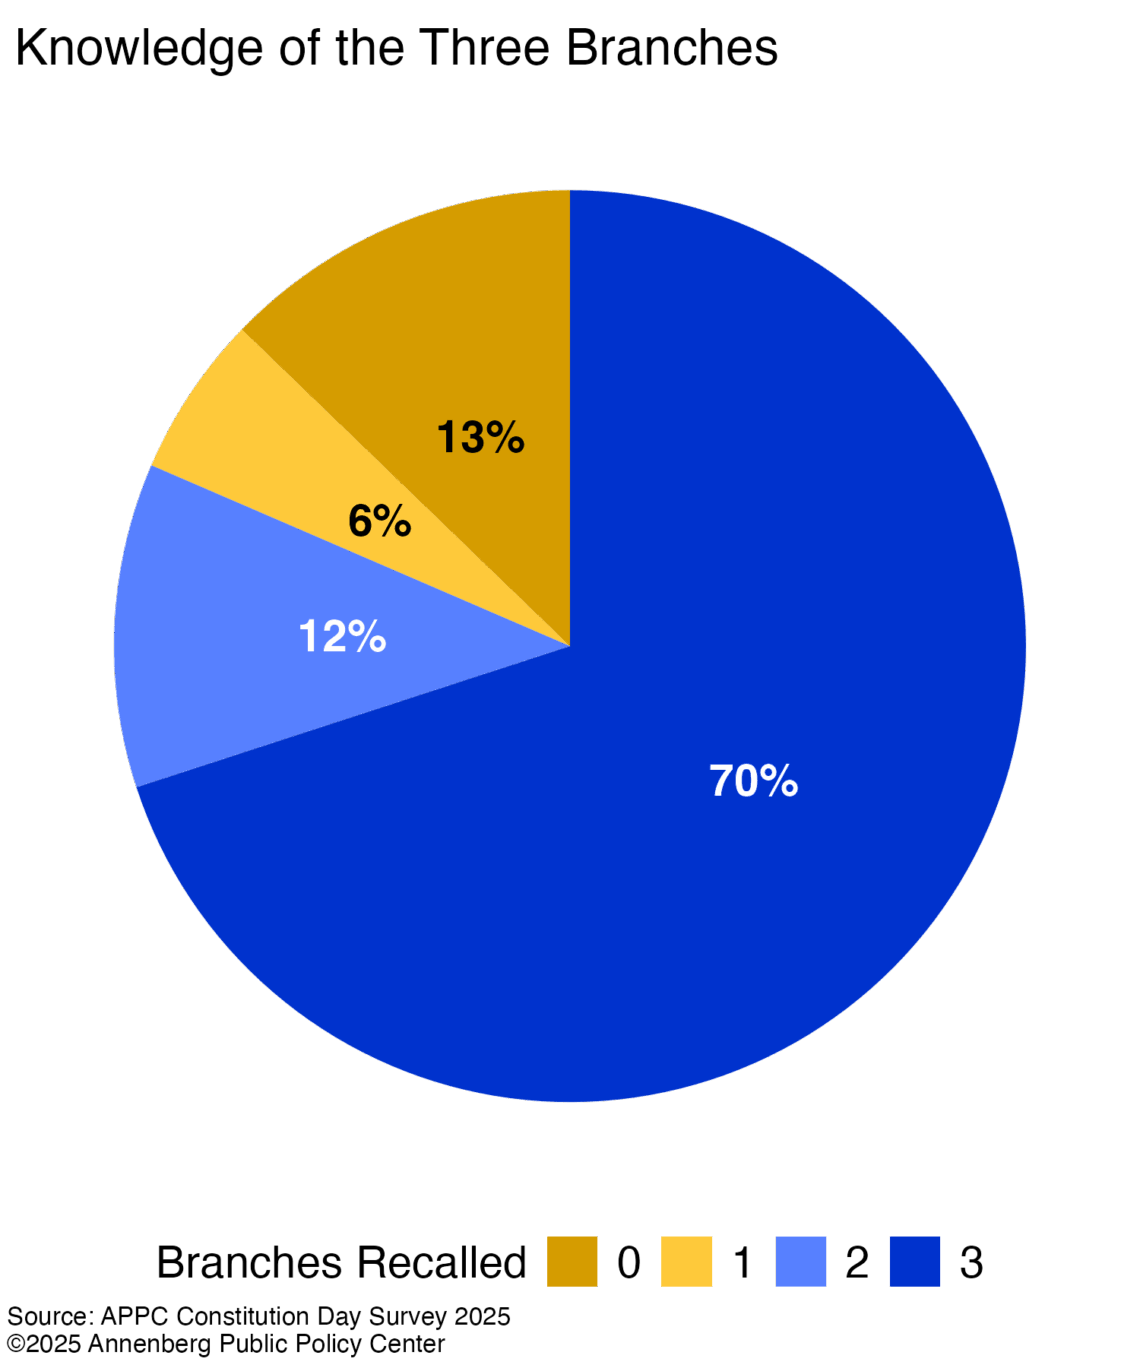
Annenberg Civics Knowledge Survey

Can you name all three branches of government?
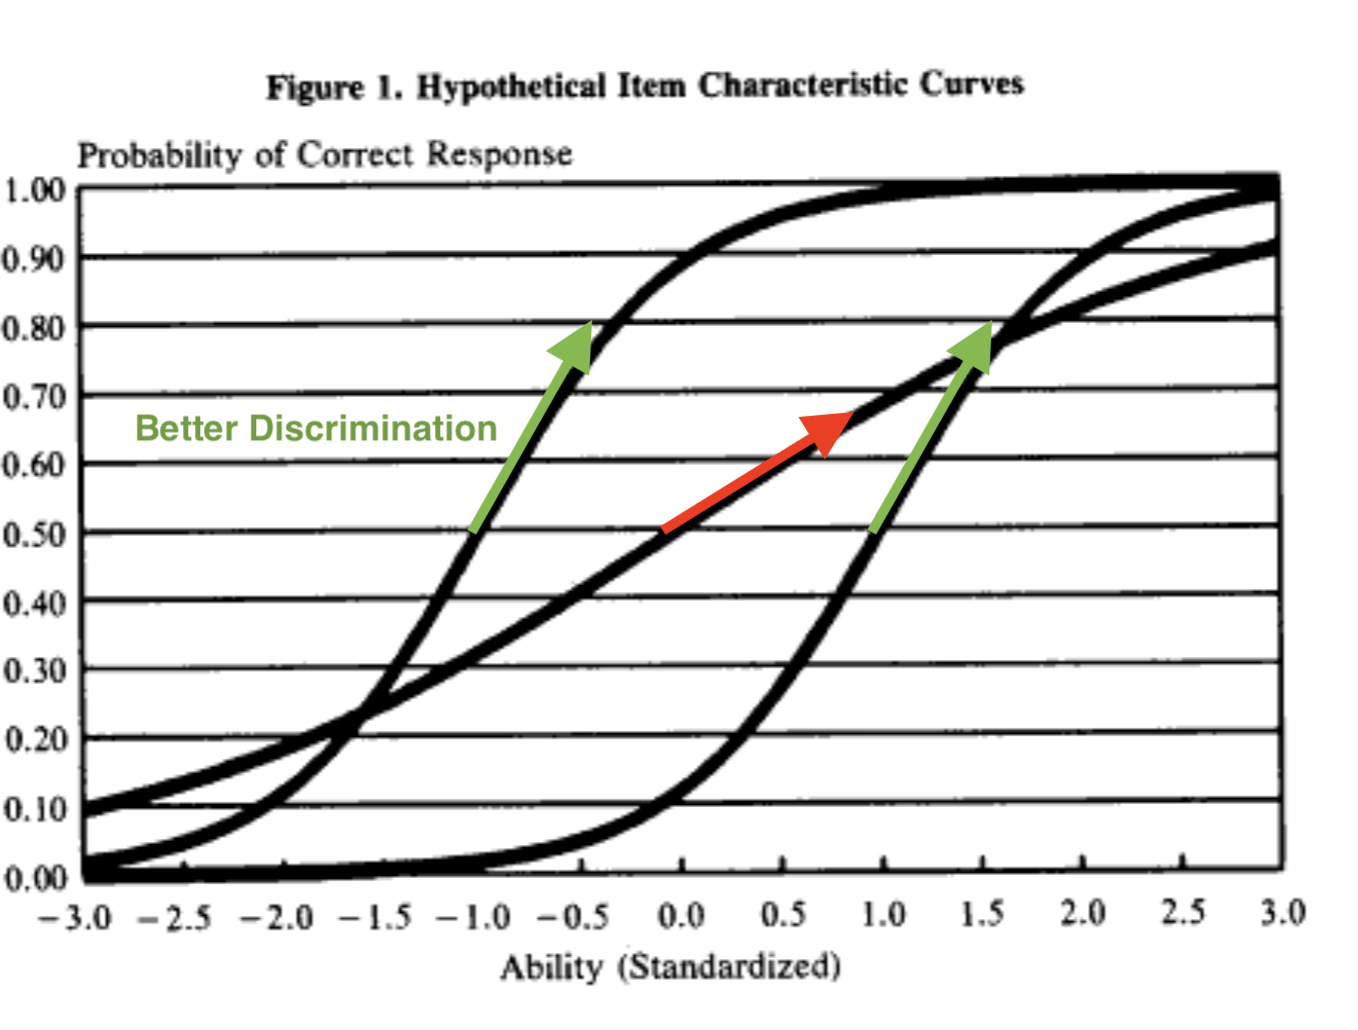
What Makes a Good Measure? Mix Difficulties
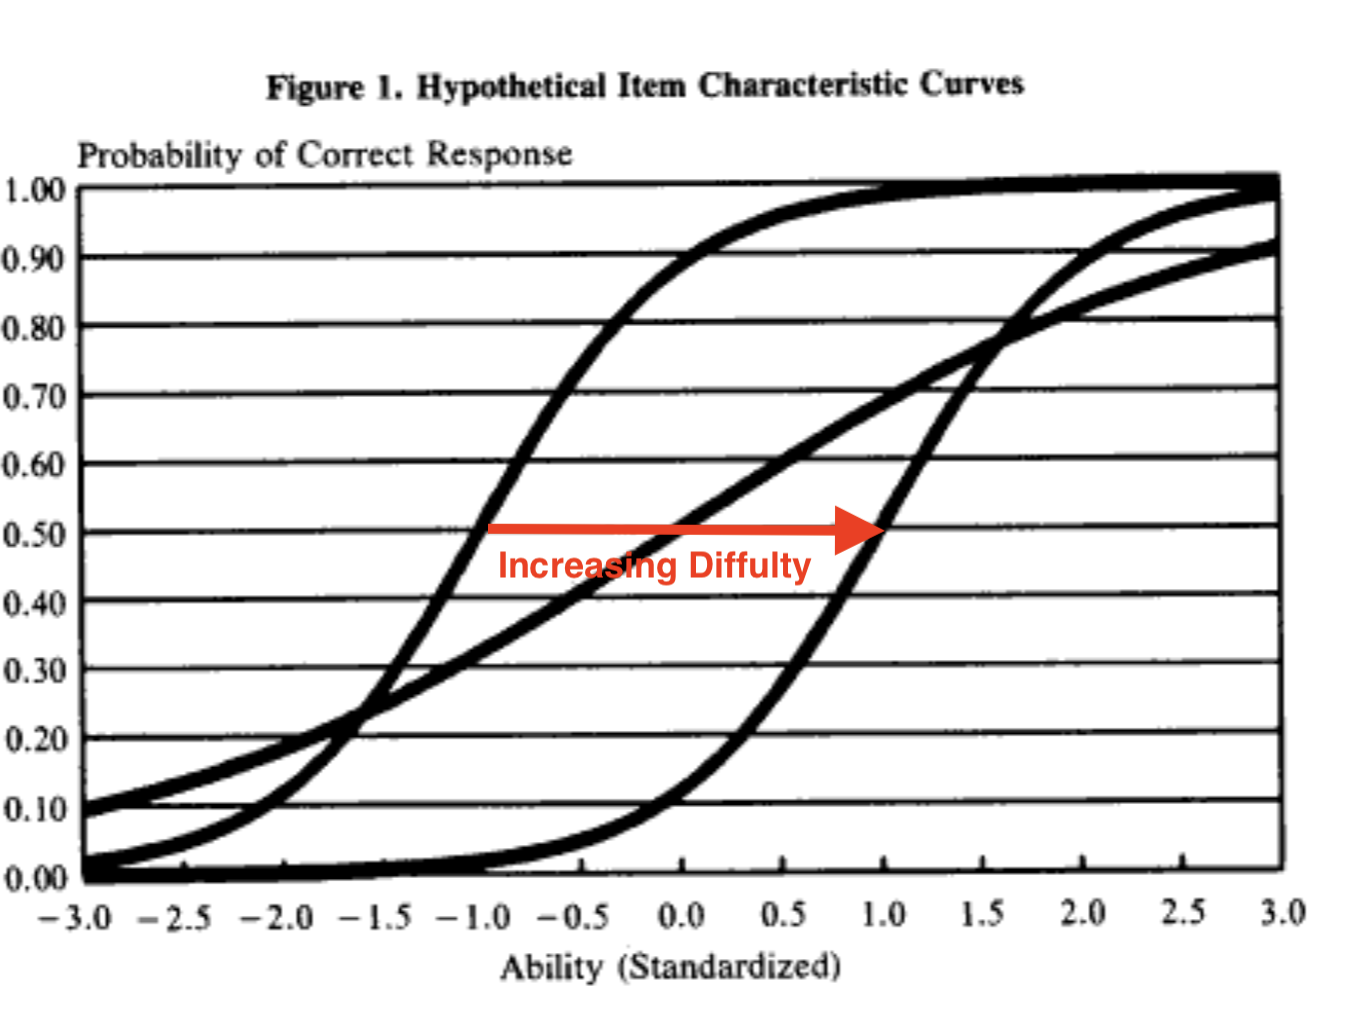
What Makes a Good Measure? High “Discrimination”
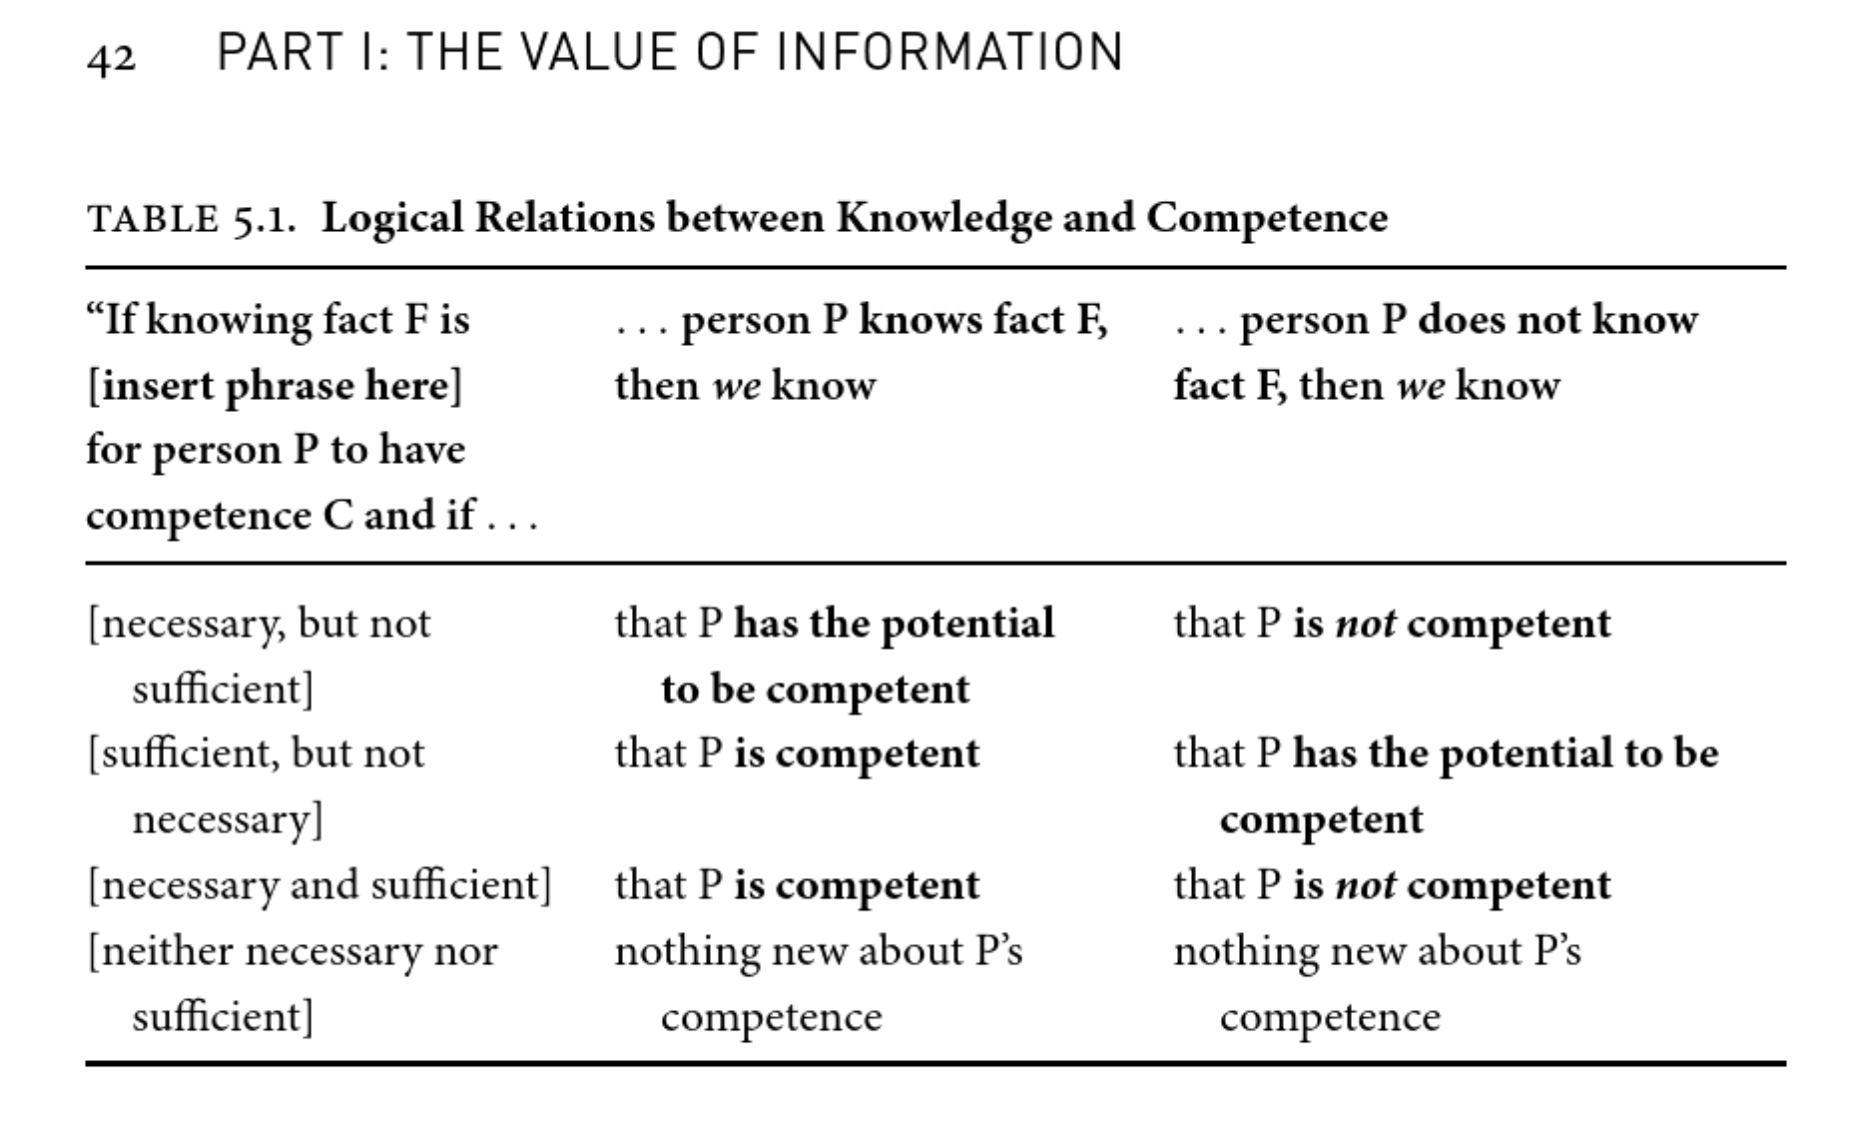
Lupia (2016)
- Offers an an important distinction between:
- Information
- Knowledge
- Competence

What is necessary and sufficient to make competent decisions?
Political Knowledge
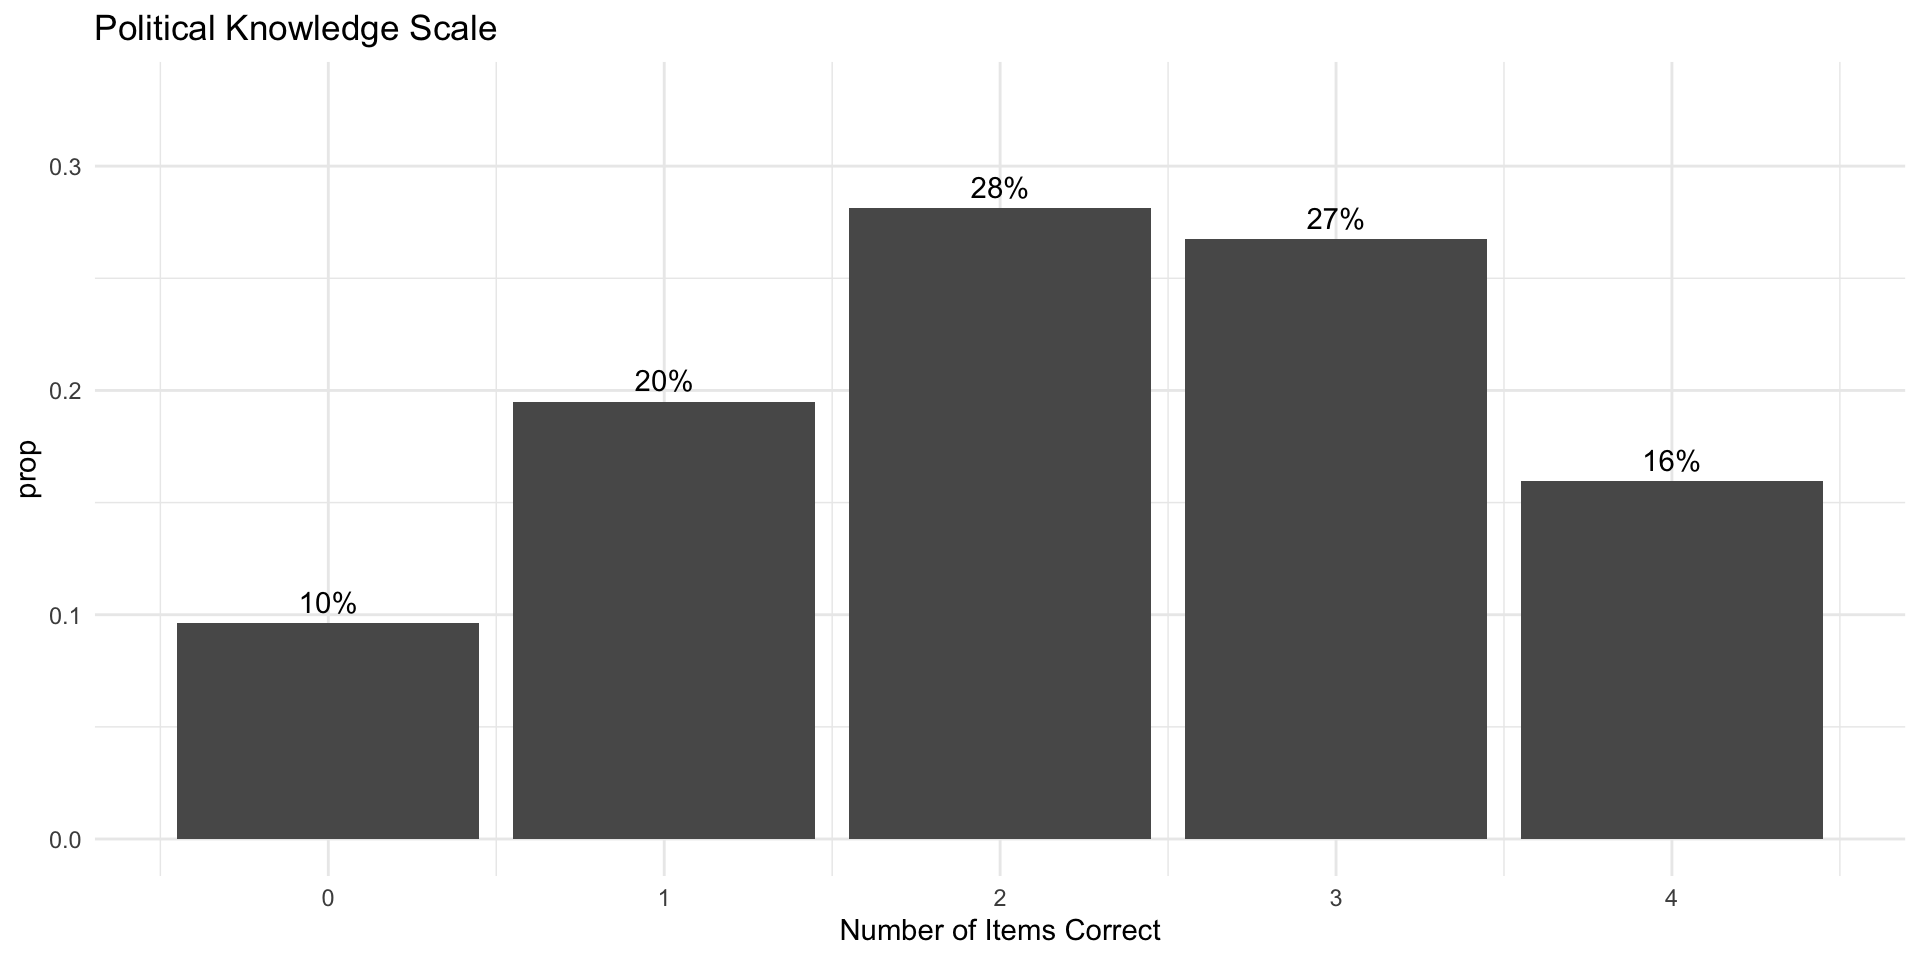
Let’s take a look at political knowledge in the 2020 American National Election Study as measured by four items:
- Length of Senate Term
- Government spending on Foreign Aid
- Party control of House
- Party control of Senate
## ---- Recode data ----
df %>%
  mutate(
    pk_senate_term = case_when(
      V201644 == 6 ~ 1,
      V201644 <  0 ~ NA,
      T ~ 0

    ),
    pk_foreign_aid = case_when(
      V201645 == 1 ~ 1,
      V201645 <  0 ~ NA,
      T ~ 0

    ),
    pk_house = case_when(
      V201646 == 1 ~ 1,
      V201646 <  0 ~ NA,
      T ~ 0

    ),
    pk_senate = case_when(
      V201647 == 2 ~ 1,
      V201647 <  0 ~ NA,
      T ~ 0

    ),
    sex = ifelse(V201600 == 2, "Female", "Male"),
    college_degree = ifelse(V201511x > 3, "College Degree", "No College"),
    race = case_when(
      V201549x == 1 ~ "White",
      V201549x == 2 ~ "Black",
      V201549x == 3 ~ "Hispanic",
      V201549x == 4 ~ "Asian",
      T ~ "Other"
    ),
    race = forcats::fct_infreq(race),
    income = case_when(
      V201617x < 0 ~ NA,
      T ~ V201617x
    ),
    political_interest = ifelse(
      V201005 < 0, NA, (V201005 - 5)*-1
    )
  ) %>%
  mutate(
    political_knowledge = rowSums(
      select(.,starts_with("pk")),
      na.rm=T
    )
    )-> df
## ---- Figures ----
## Individual items
df %>%
summarise(
`Senate Term` = mean(pk_senate_term,na.rm=T),
`Foreign Aid` = mean(pk_foreign_aid, na.rm = T),
`Dem House` = mean(pk_house, na.rm=T),
`Rep Senate` = mean(pk_senate, na.rm = T)
) %>%
pivot_longer(
cols = 1:4,
names_to = "Item"
) %>%
mutate(
Item = forcats::fct_reorder(Item,value),
`Percent Correct` = round(value*100,2)
) %>%
ggplot(aes(Item, `Percent Correct`))+
geom_bar(stat = "identity")+
coord_flip()+
geom_text(aes(label = scales::percent(value)),
hjust = -.25)+
ylim(0,100)+
labs(
title="Individual Knowledge Items",
x = ""
) +
theme_minimal()-> fig1
## Knowledge Scale
df %>%
group_by(political_knowledge) %>%
summarise(
n = n(),
prop = n()/nrow(df),
Percent = scales::percent(prop)
) %>%
ggplot(aes(political_knowledge, prop))+
geom_bar(stat = "identity")+
scale_y_continuous(labels = label_percent())+
geom_text(aes(y = prop, x= political_knowledge,label = Percent), vjust = -.5)+
ylim(0, .33)+
labs(
x = "Number of Items Correct",
title = "Political Knowledge Scale"
) +
theme_minimal() -> fig2
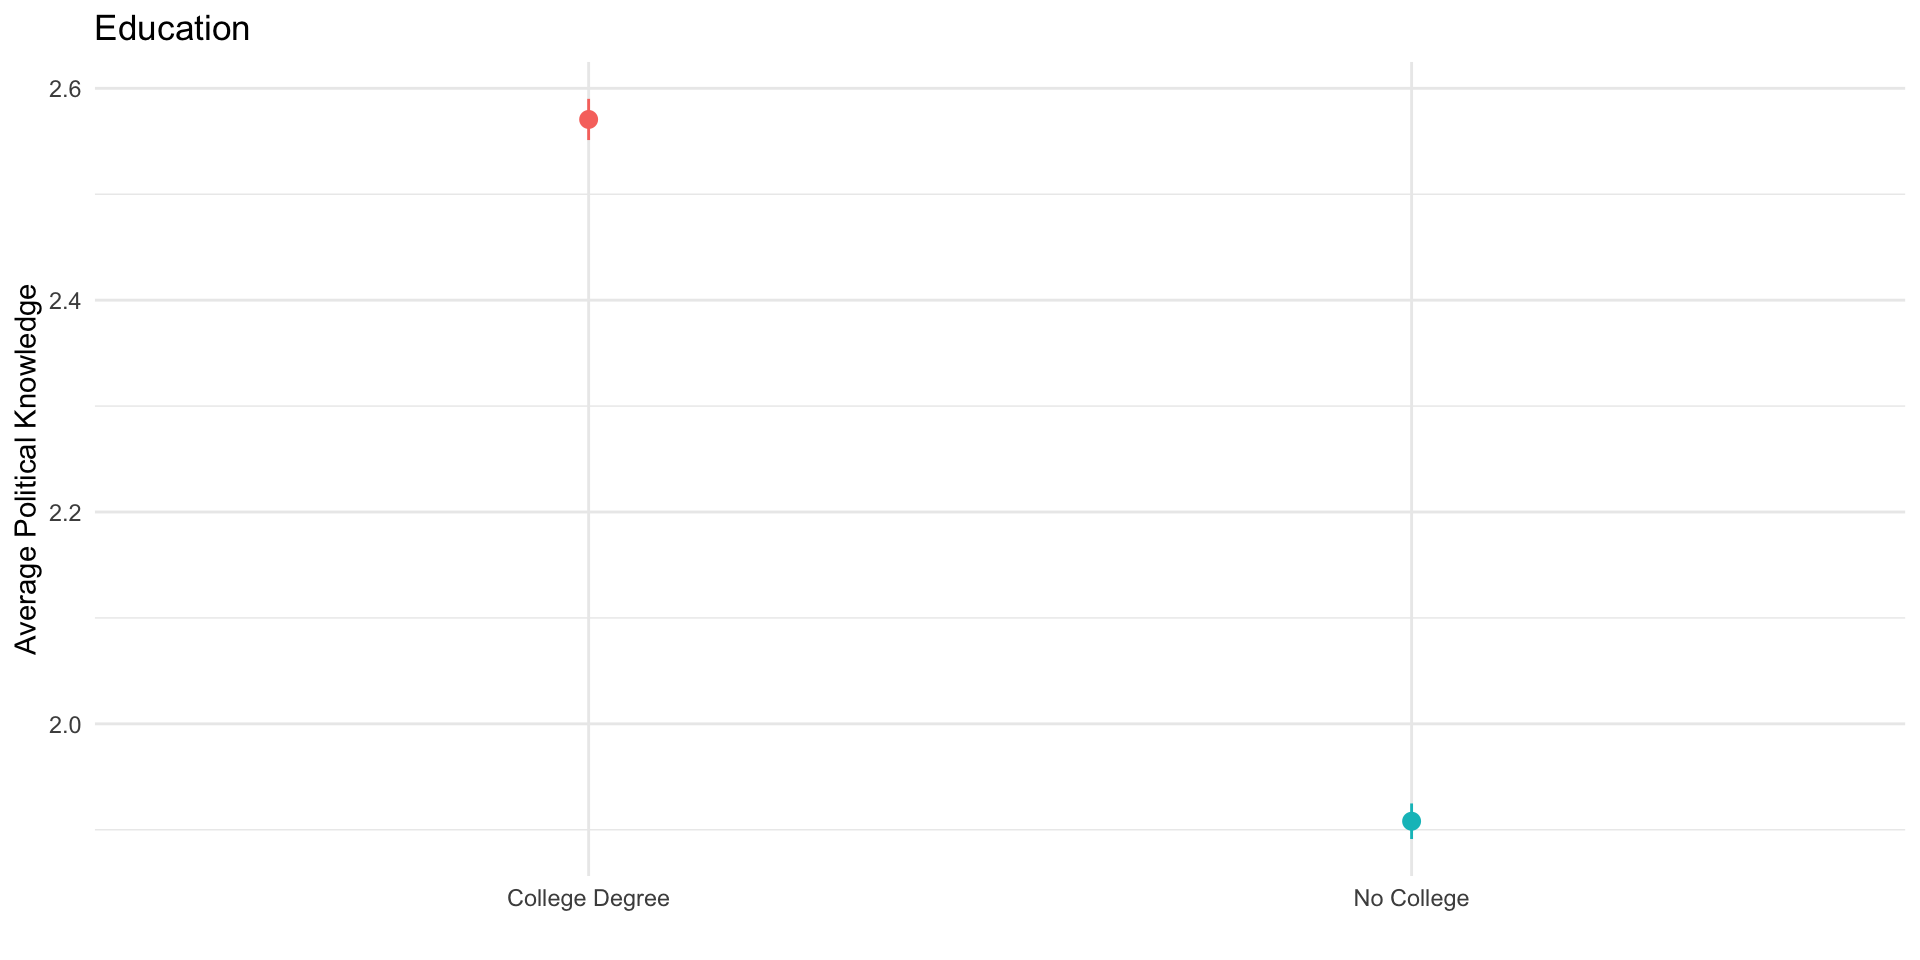
# ---- Knowledge Gaps ----
# Education
df %>%
ggplot(aes(college_degree, political_knowledge,
col = college_degree))+
stat_summary()+
guides(col = "none")+
theme_minimal()+
labs(
x= "",
y = "Average Political Knowledge",
title = "Education"
) -> fig3
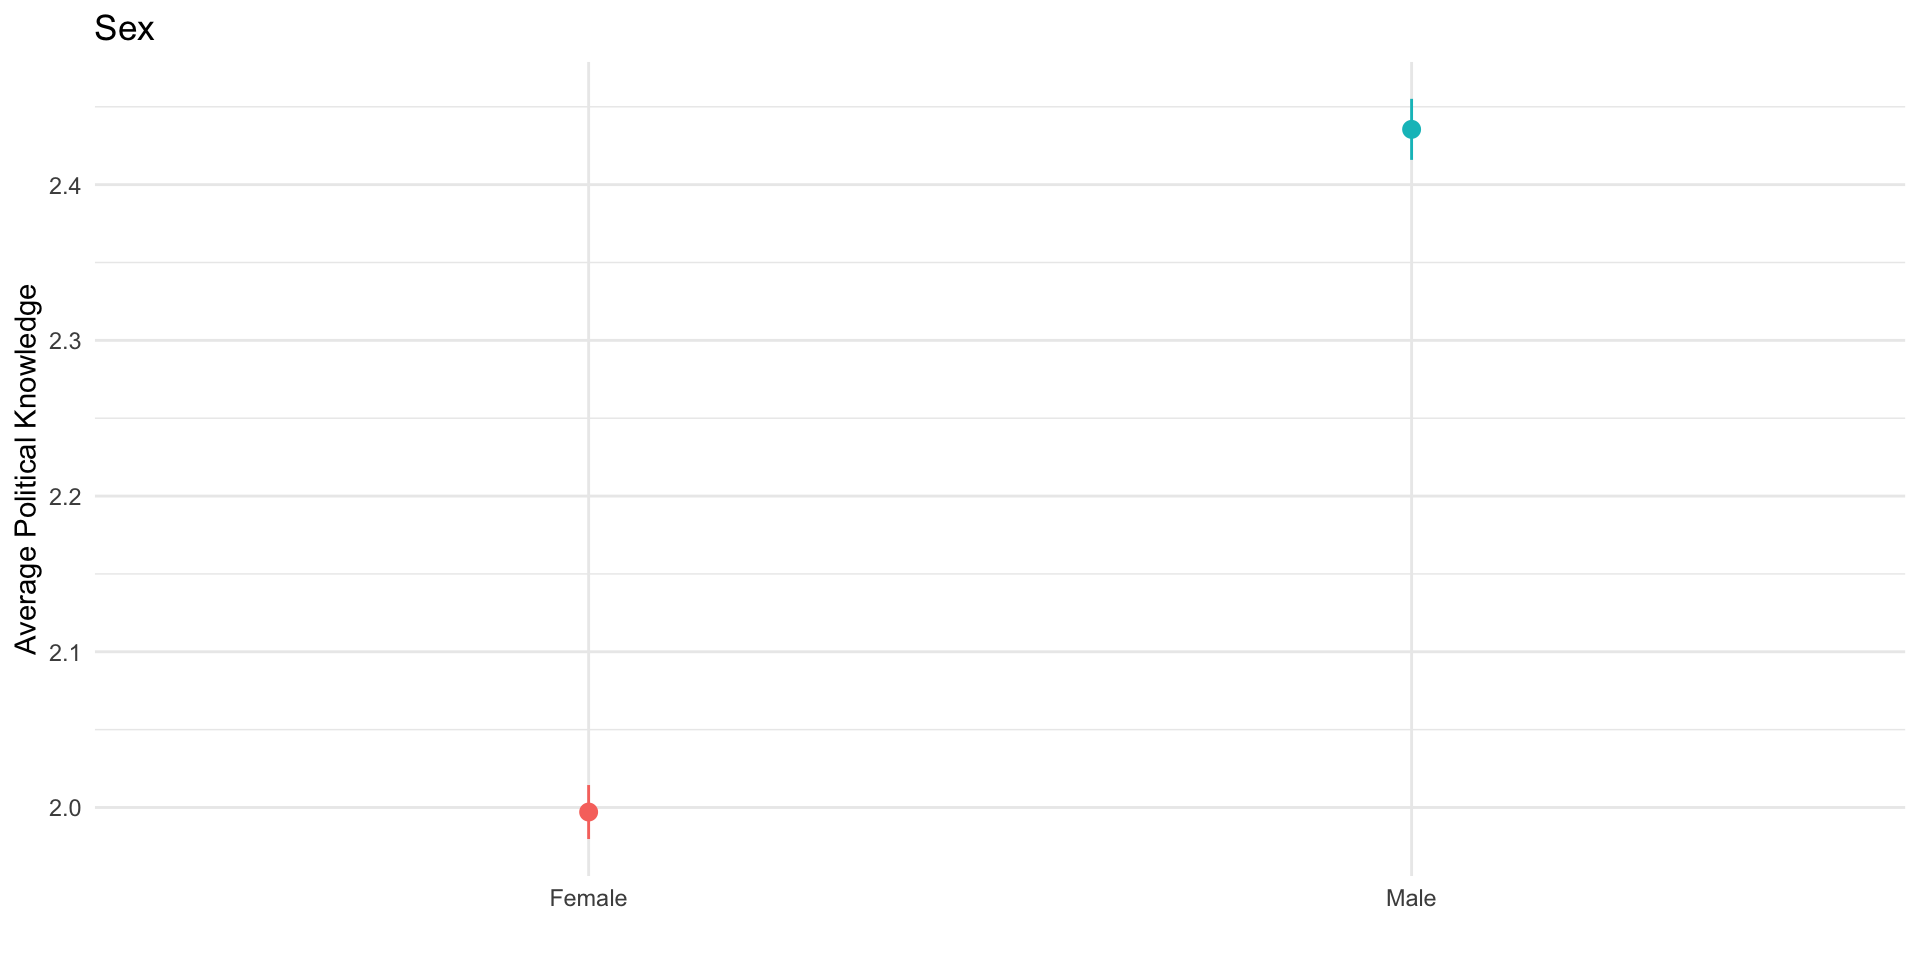
# Sex
df %>%
ggplot(aes(sex, political_knowledge,
col = sex))+
stat_summary()+
guides(col = "none")+
theme_minimal()+
labs(
x= "",
y = "Average Political Knowledge",
title = "Sex"
) -> fig4
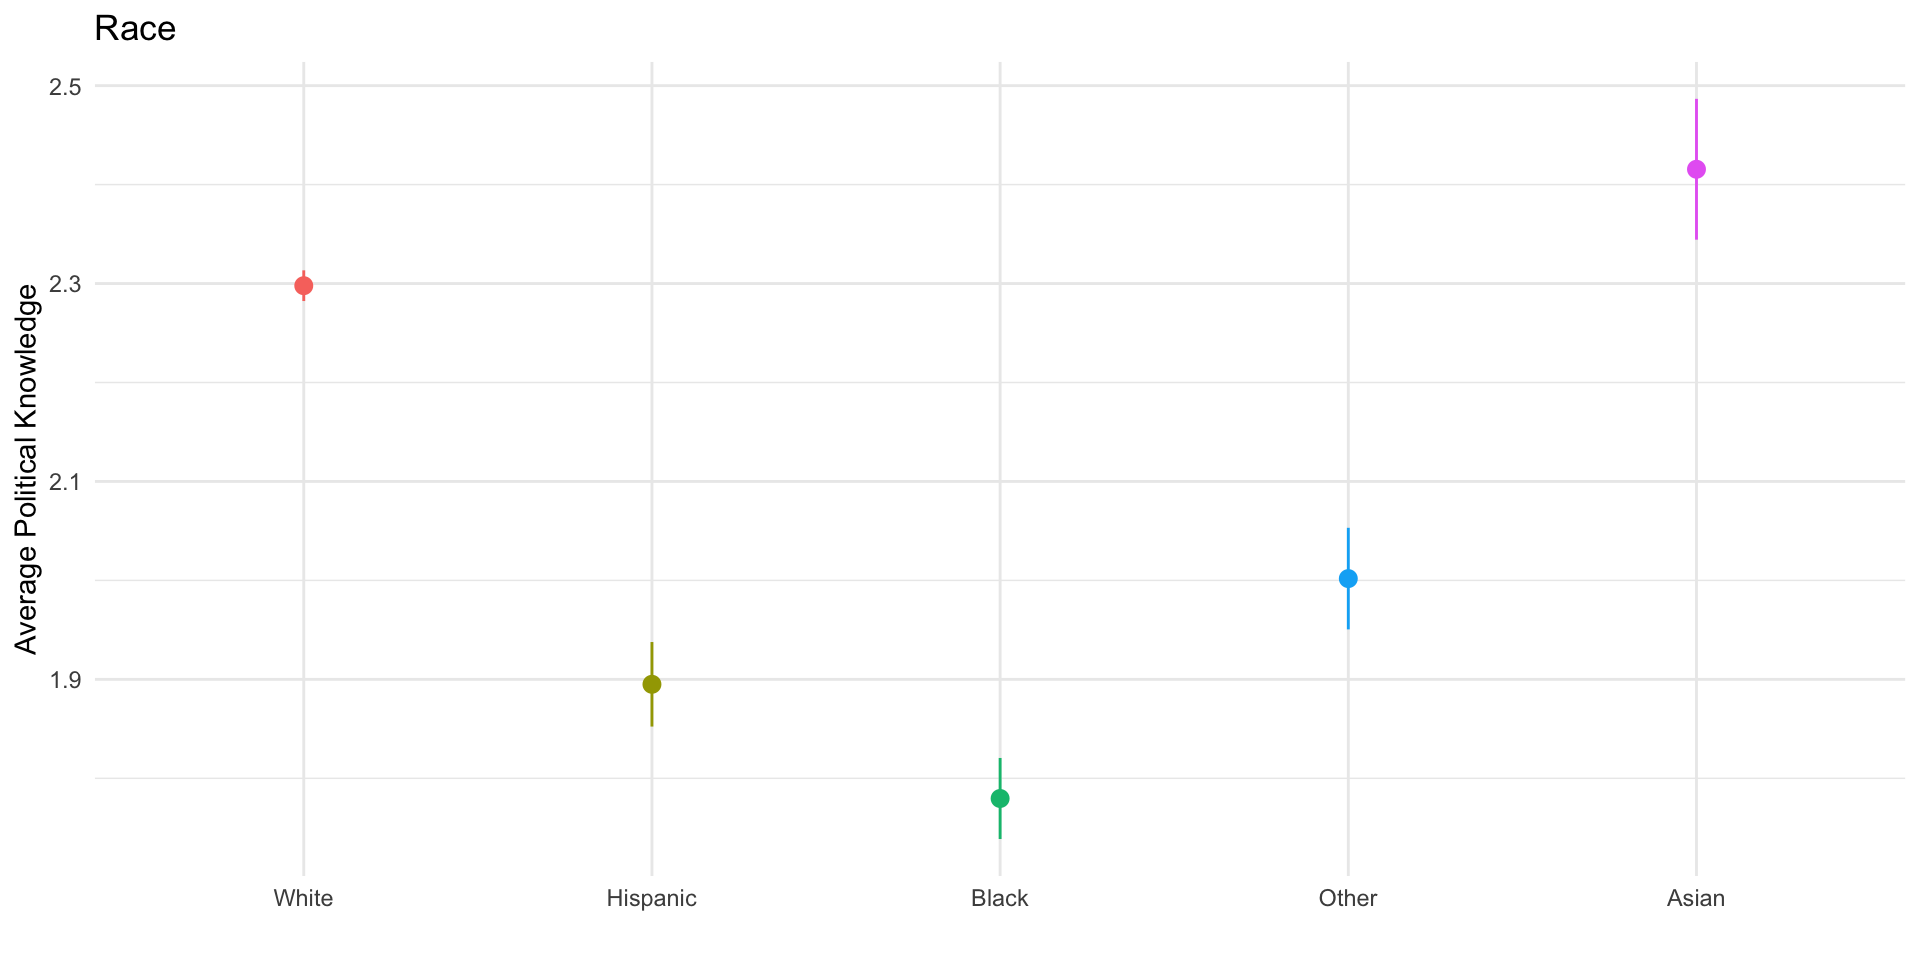
# Race
df %>%
ggplot(aes(race, political_knowledge,
col = race))+
stat_summary()+
guides(col = "none")+
theme_minimal()+
labs(
x= "",
y = "Average Political Knowledge",
title = "Race"
) -> fig5
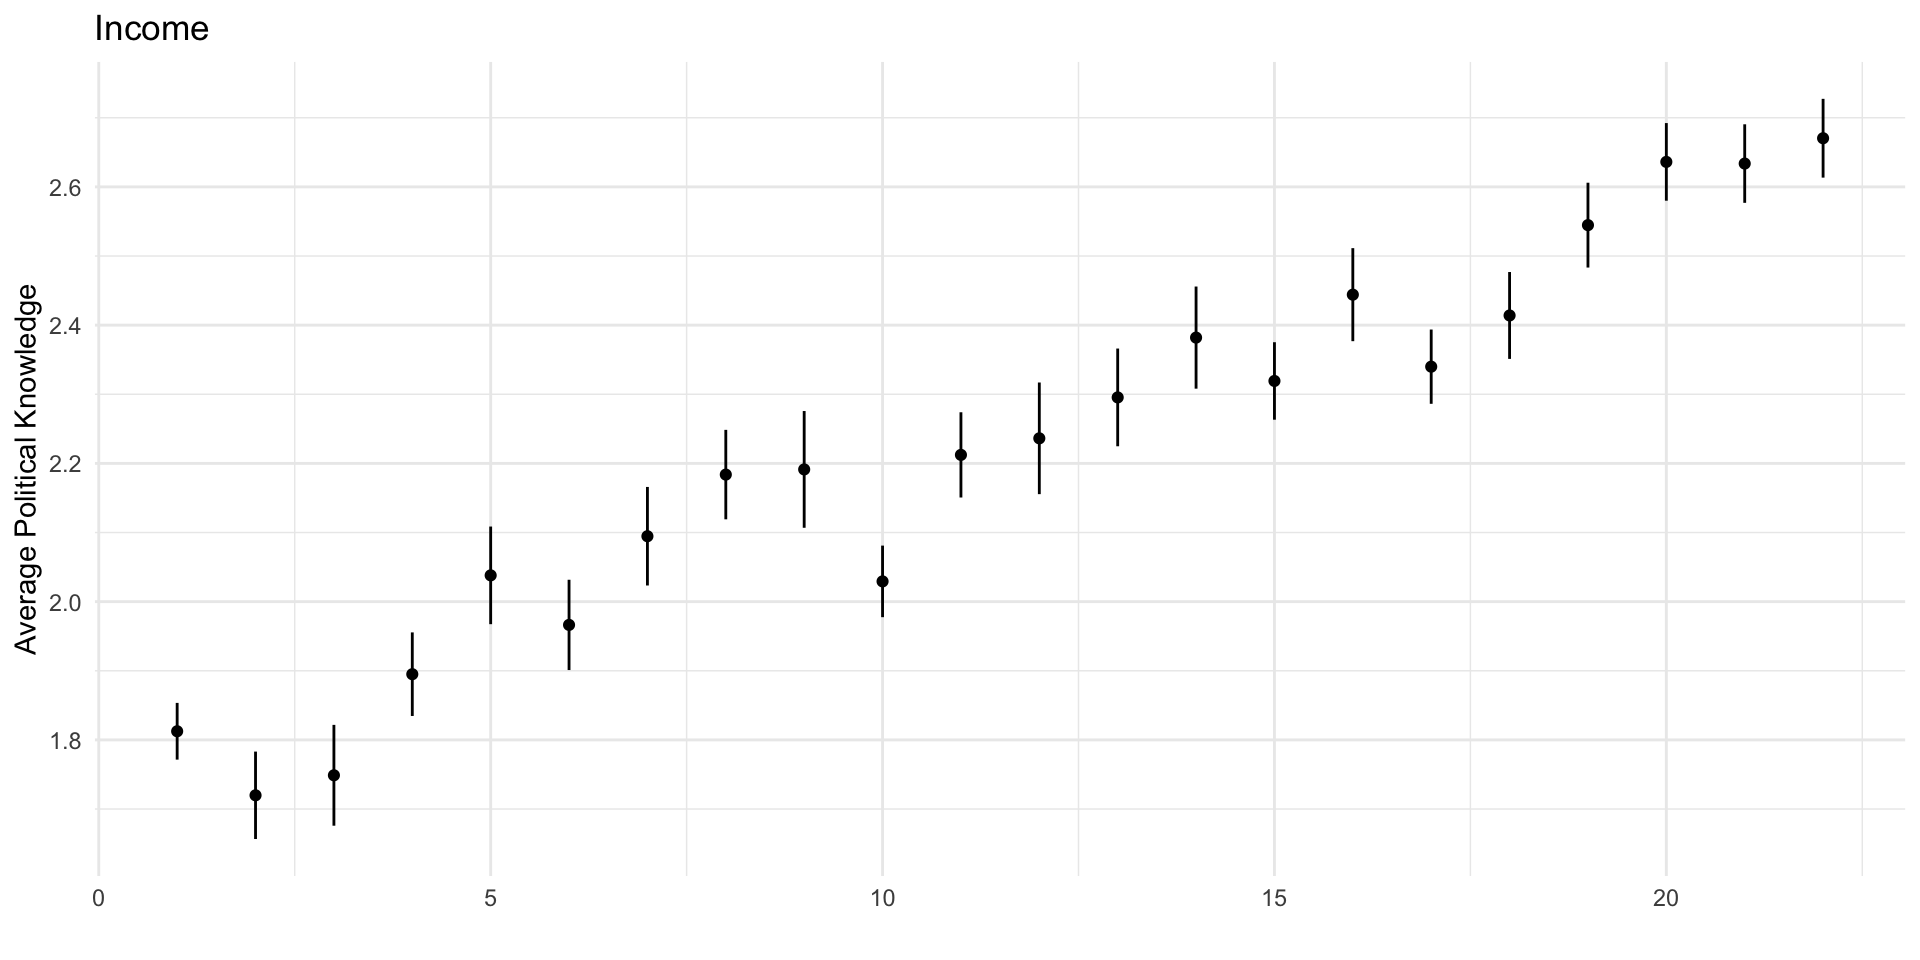
# Income
df %>%
ggplot(aes(income, political_knowledge,
))+
stat_summary(size=.2)+
theme_minimal()+
labs(
x= "",
y = "Average Political Knowledge",
title = "Income"
) -> fig6# ---- Models ----
## Bivariate
m1 <- lm_robust(political_knowledge ~ college_degree, df)
m2 <- lm_robust(political_knowledge ~ sex, df)
m3 <- lm_robust(political_knowledge ~ race, df)
m4 <- lm_robust(political_knowledge ~ income, df)
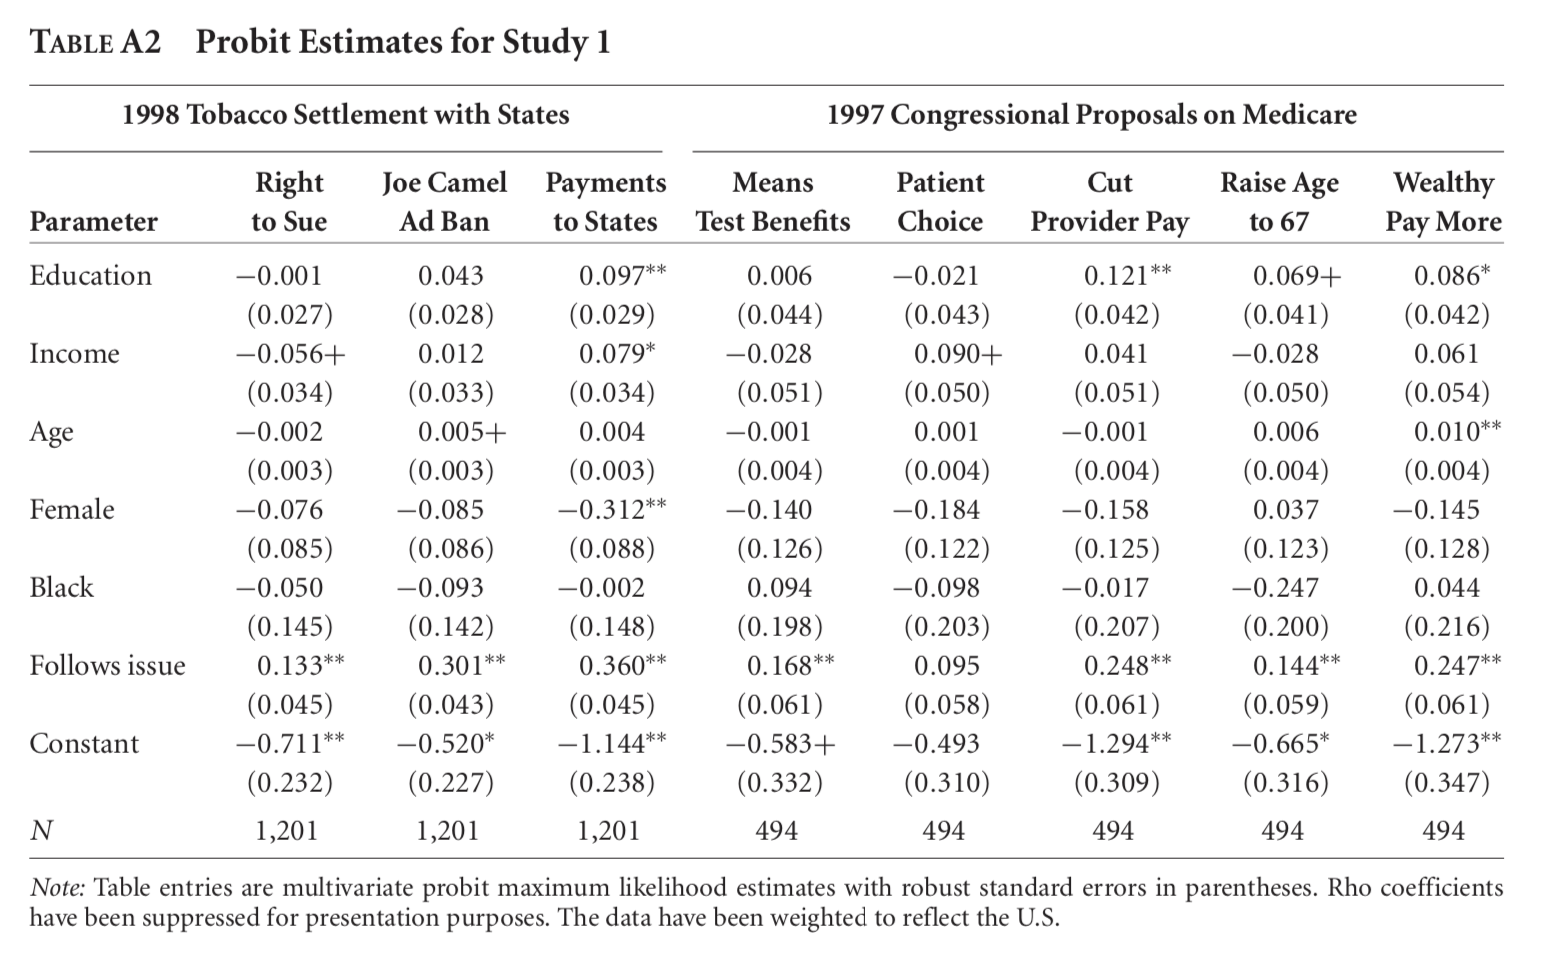
## Multiple Regression
m5 <- lm_robust(political_knowledge ~
college_degree + sex + race + income + political_interest , df)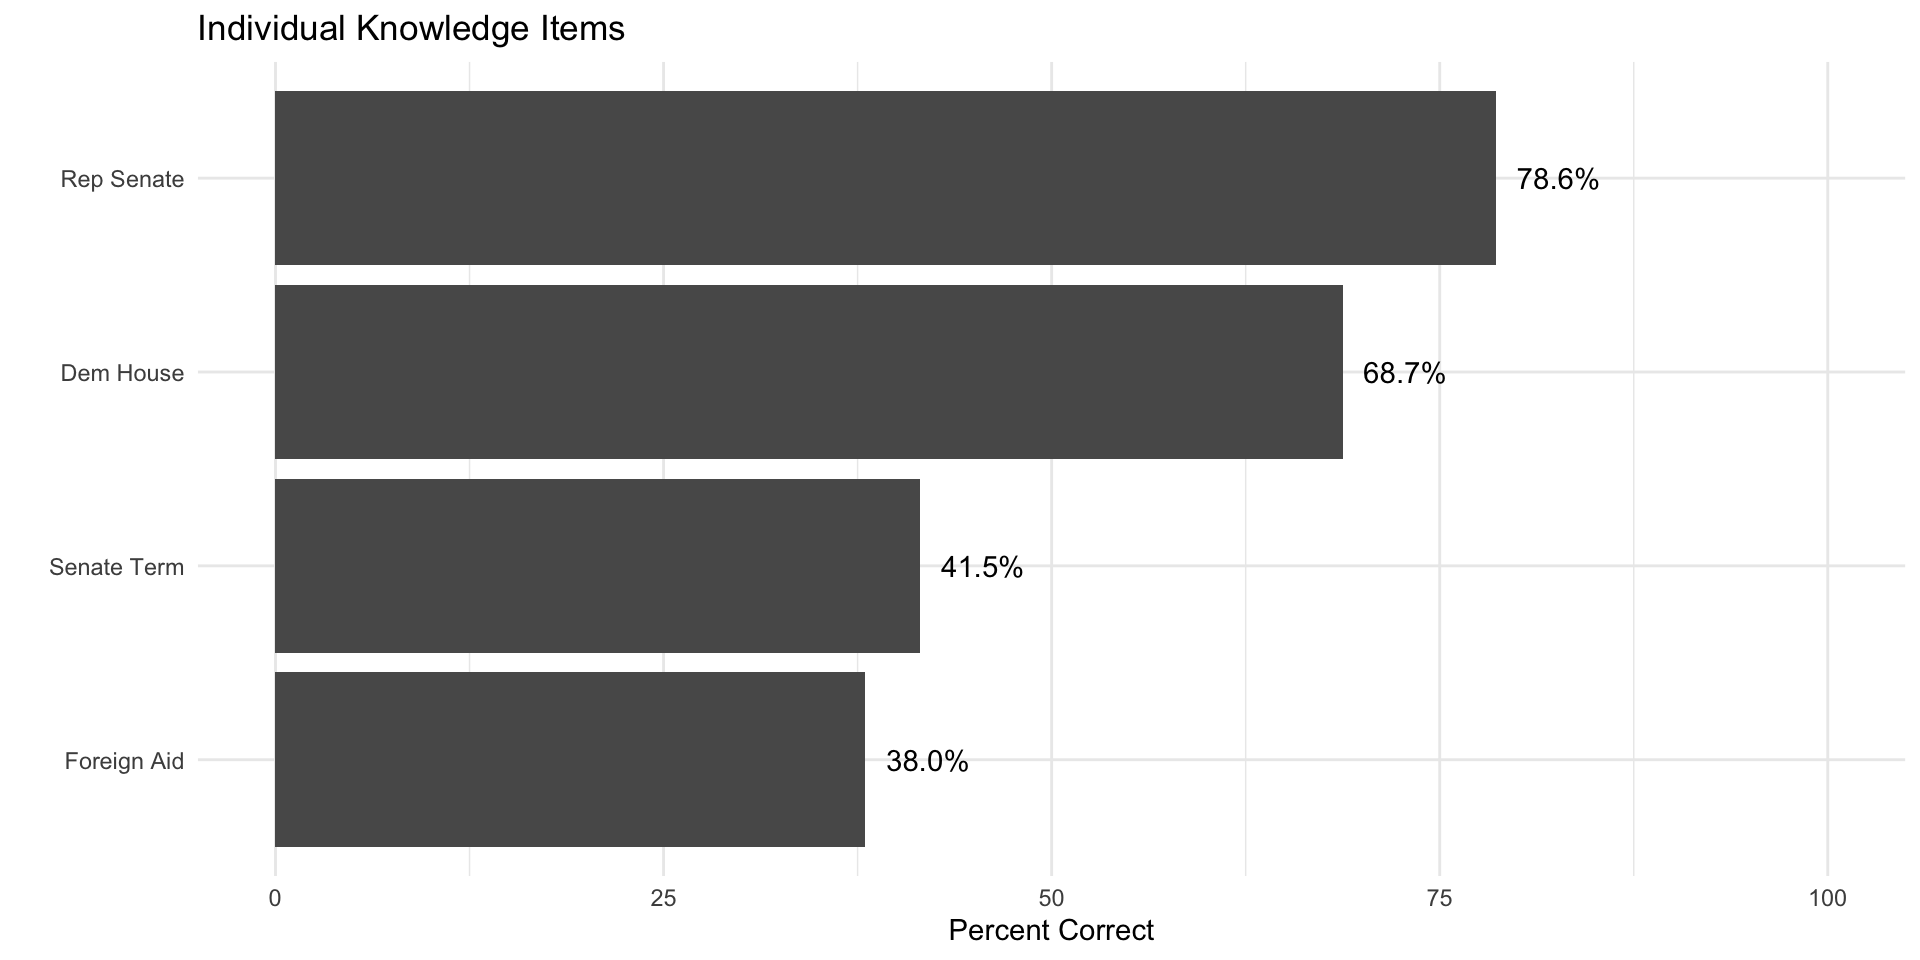
Knowledge Gaps
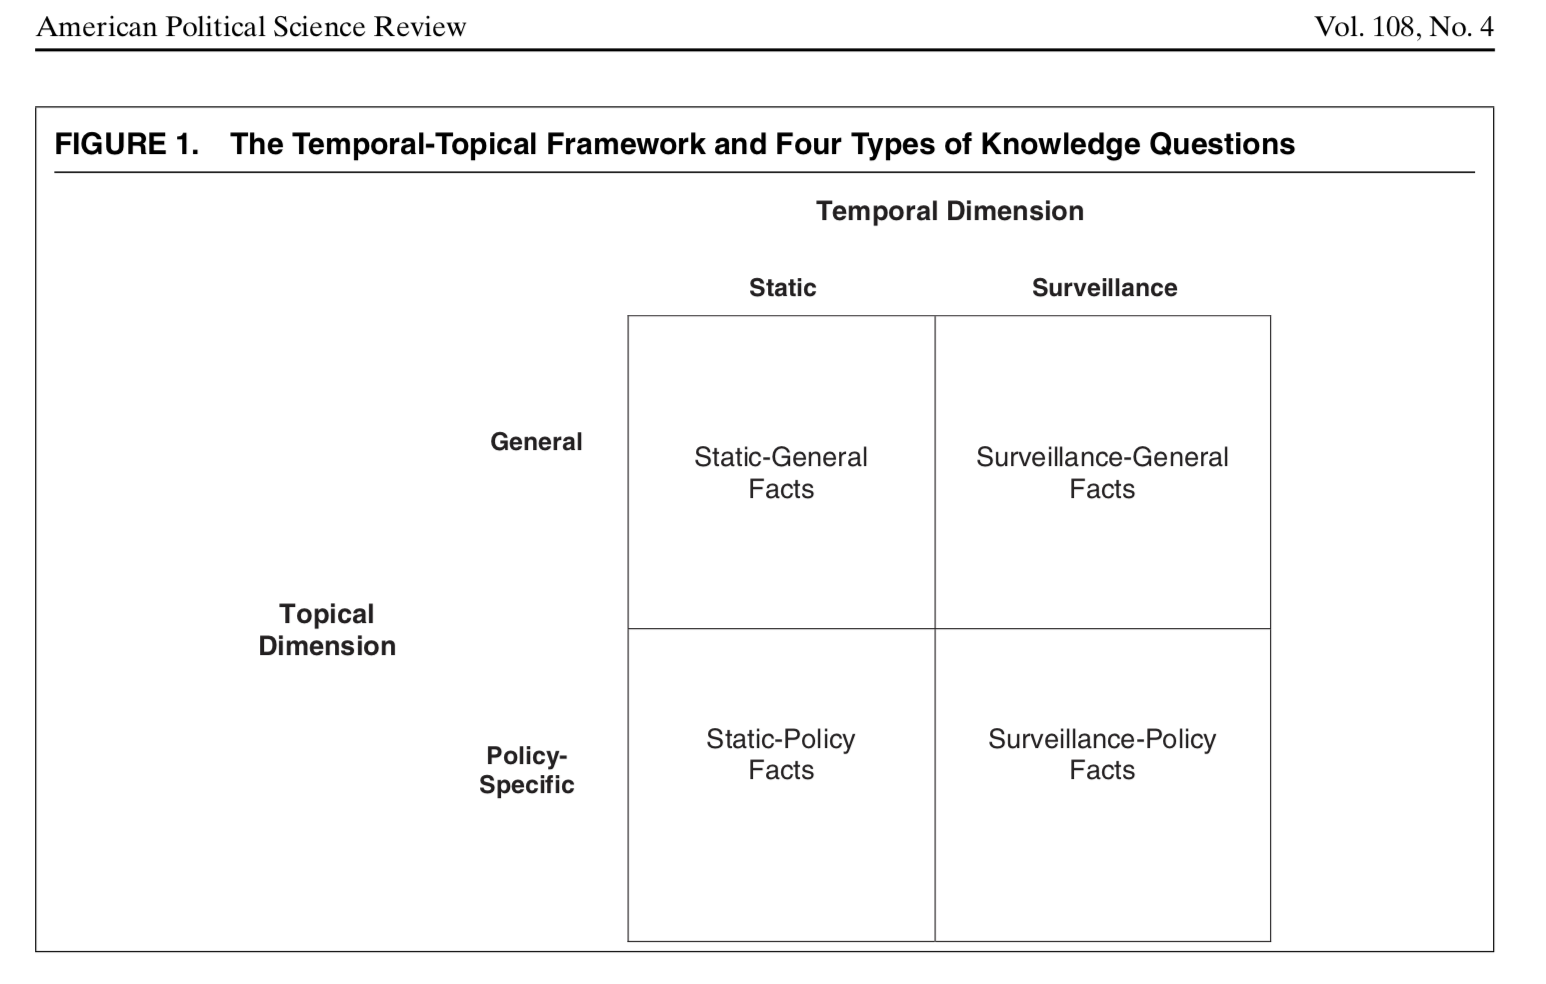
What’s the theoretical framework
- Jerit et al. lay the foundation for a distinction made by Barabas et al. (2014) between the type and temporal dimensions of knowledge
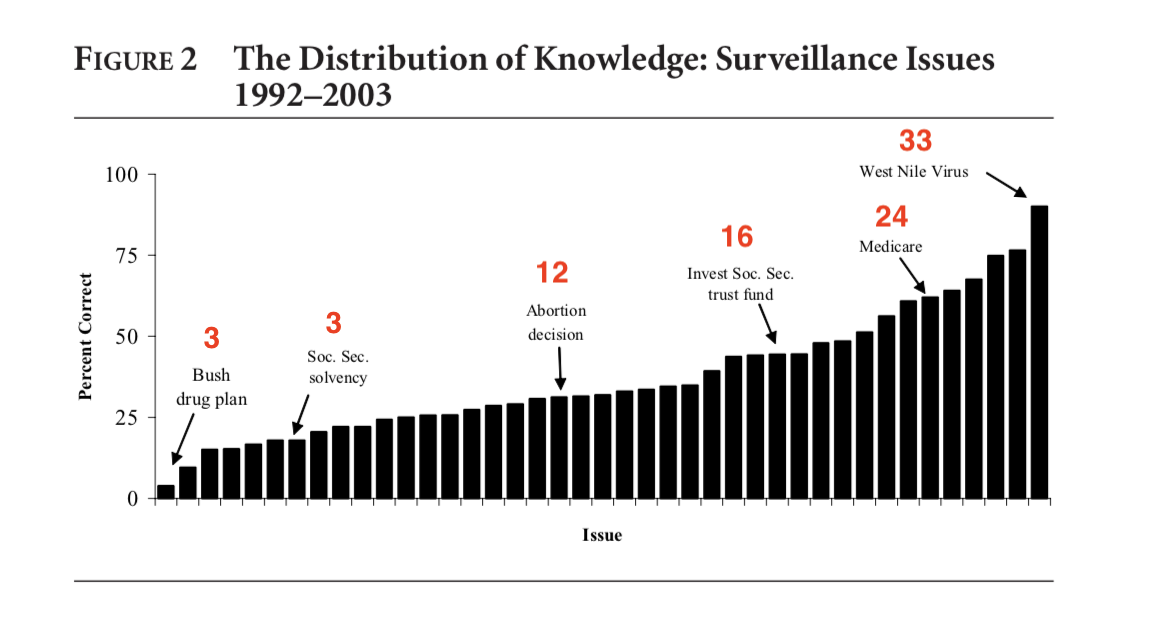
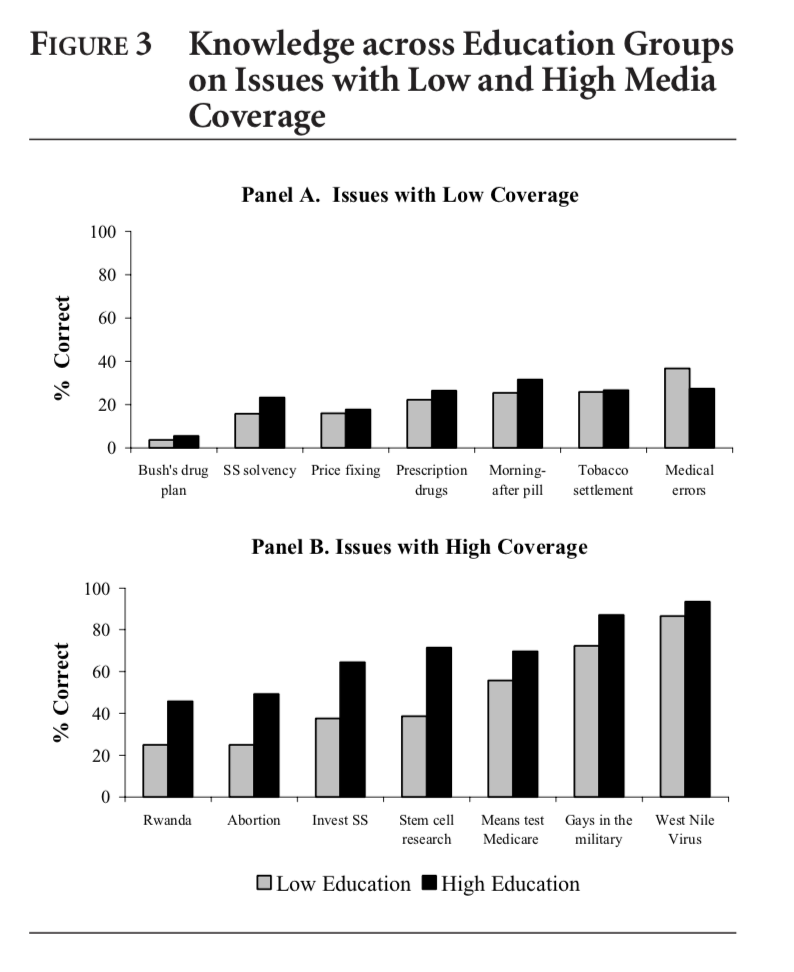
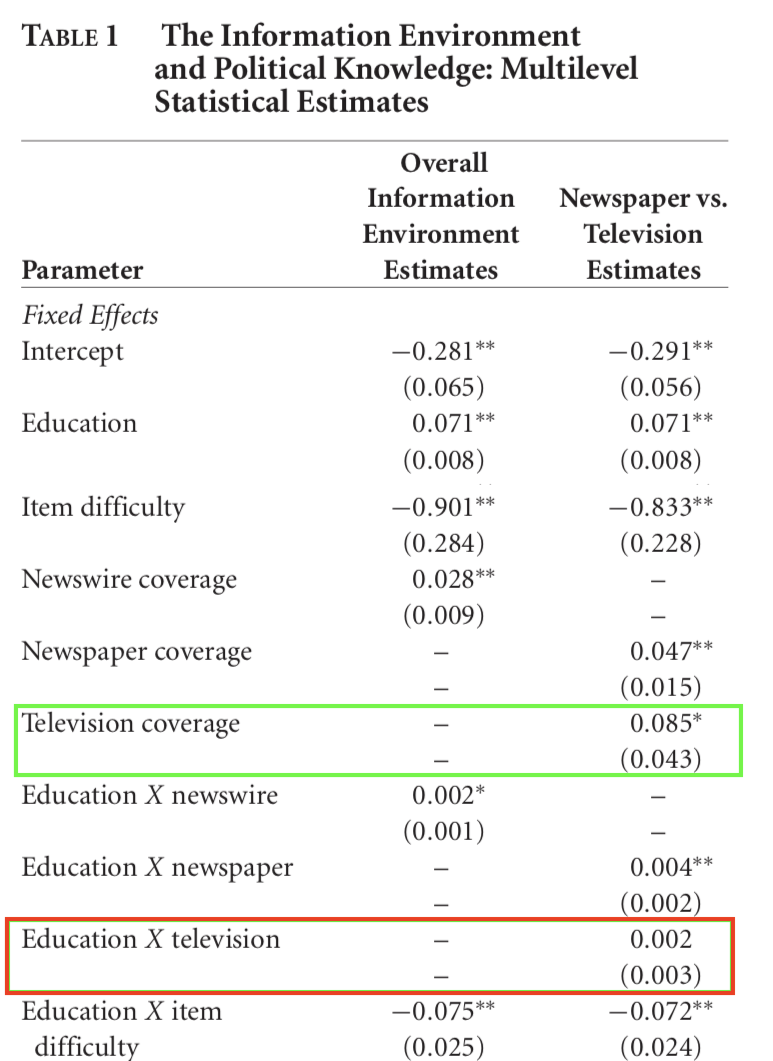
Increasing Media Coverage Increases Knowledge (H1a)
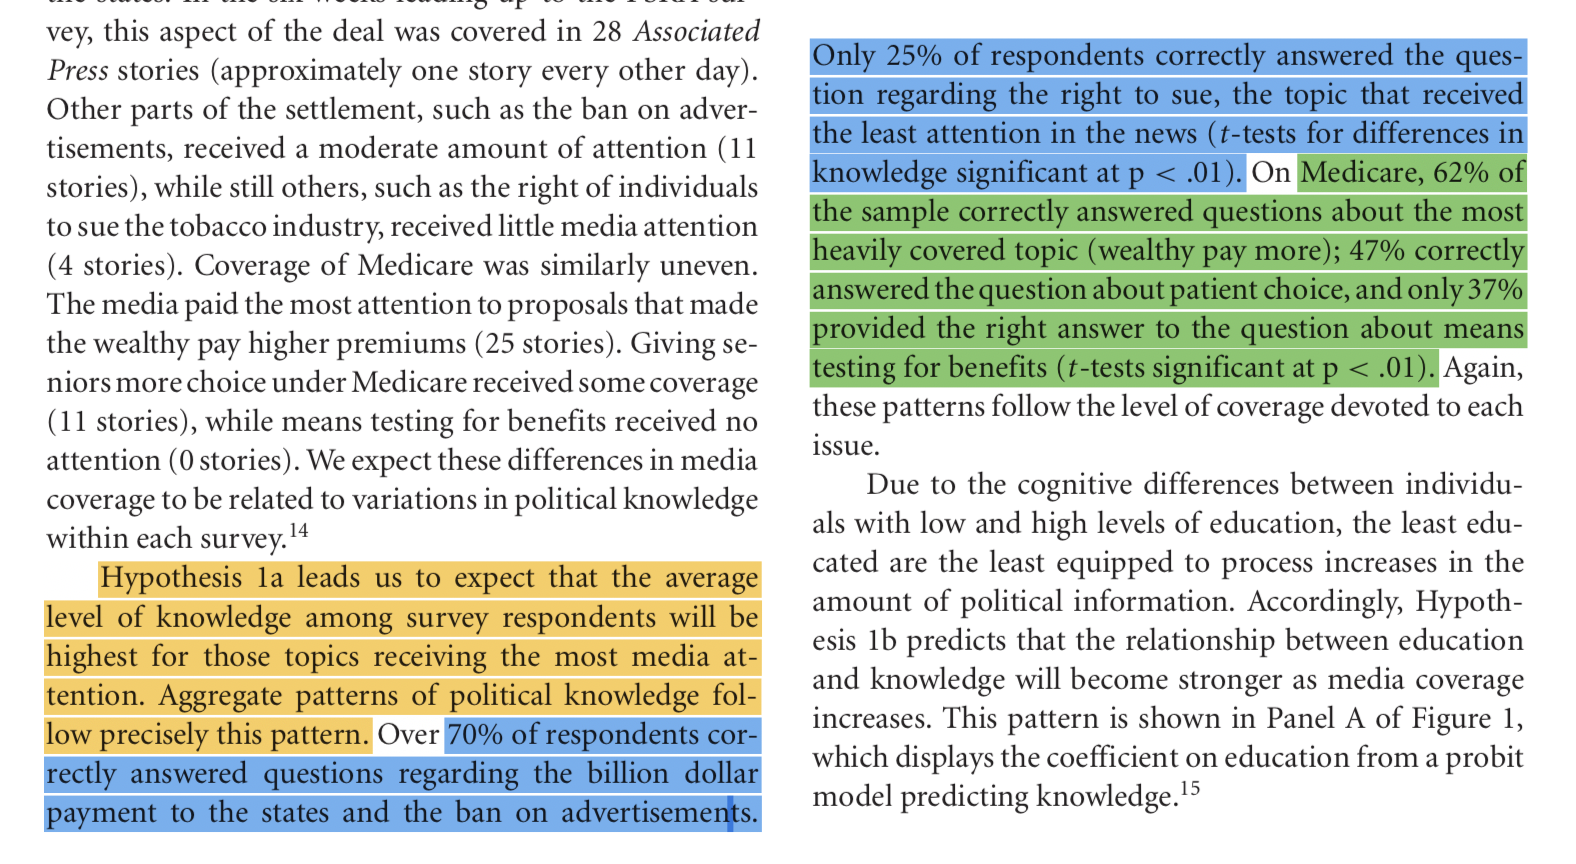
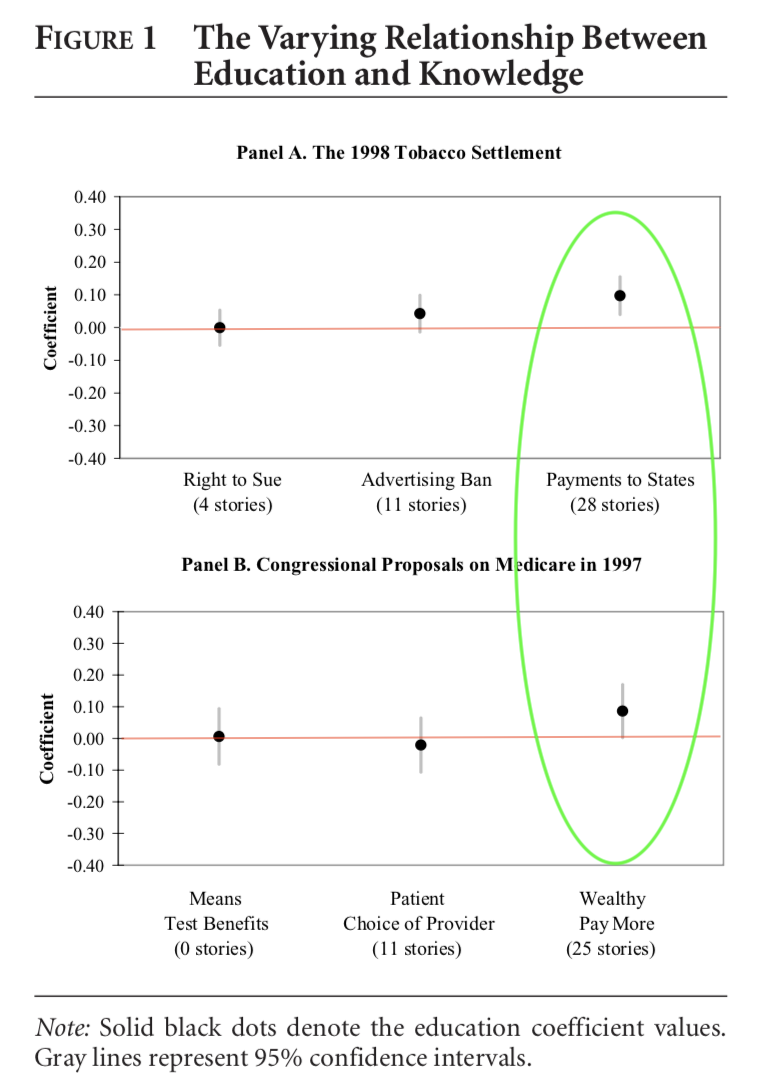
Knowledge Gaps Increase When There is More Coverage (H1b)
Is this Always True?
Increasing Media Coverage Increases Knowledge (H1a)
Knowledge Gaps Increase with more Media Coverage (H1b)
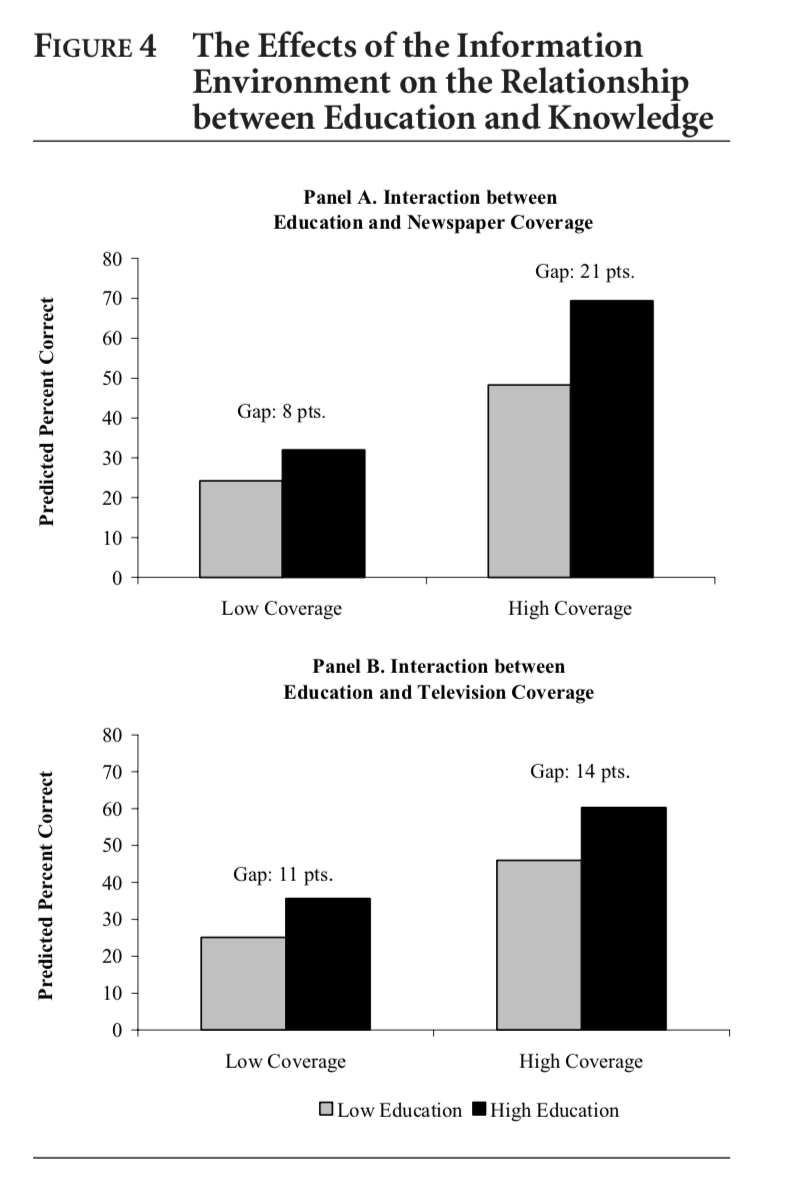
Newspaper Coverage Benefits the Informationally Rich (H2a)
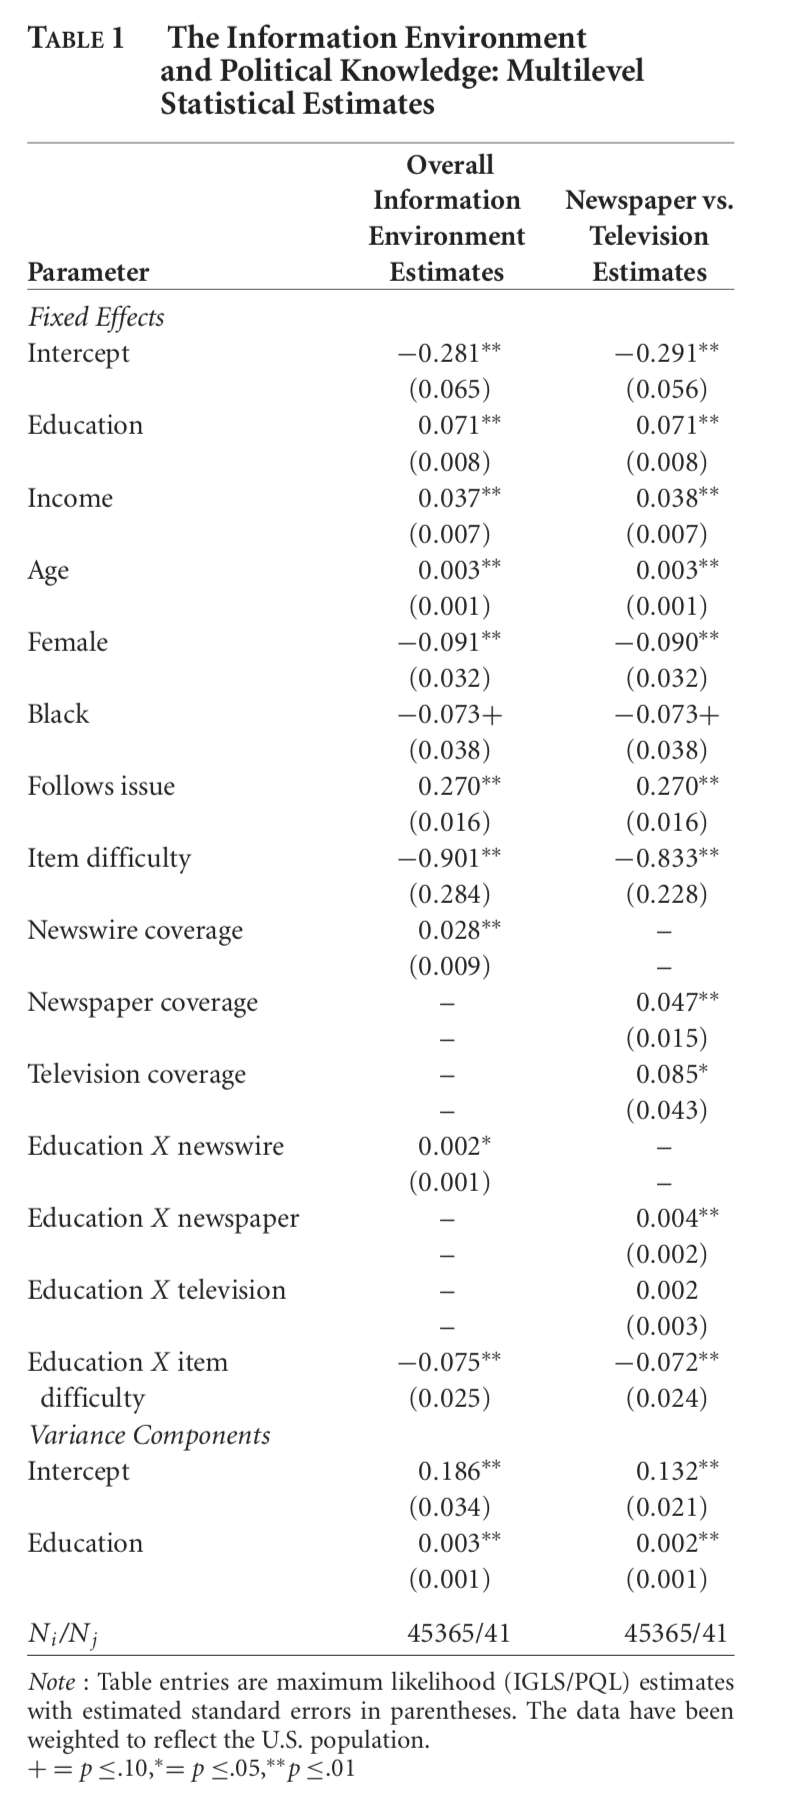
Newspaper Coverage Benefits the Informationally Rich (H2a)
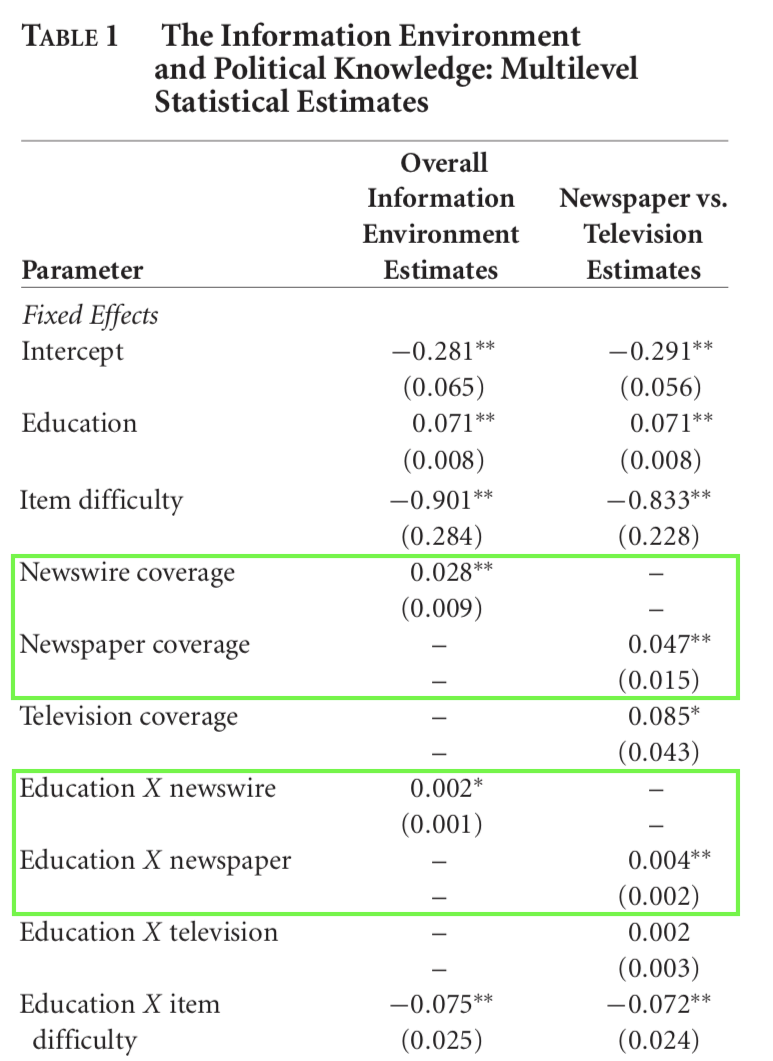
Television Coverage Offers Wider Benefits (H2b)
Media Coverage and Knowledge Gaps
What’s the theoretical framework
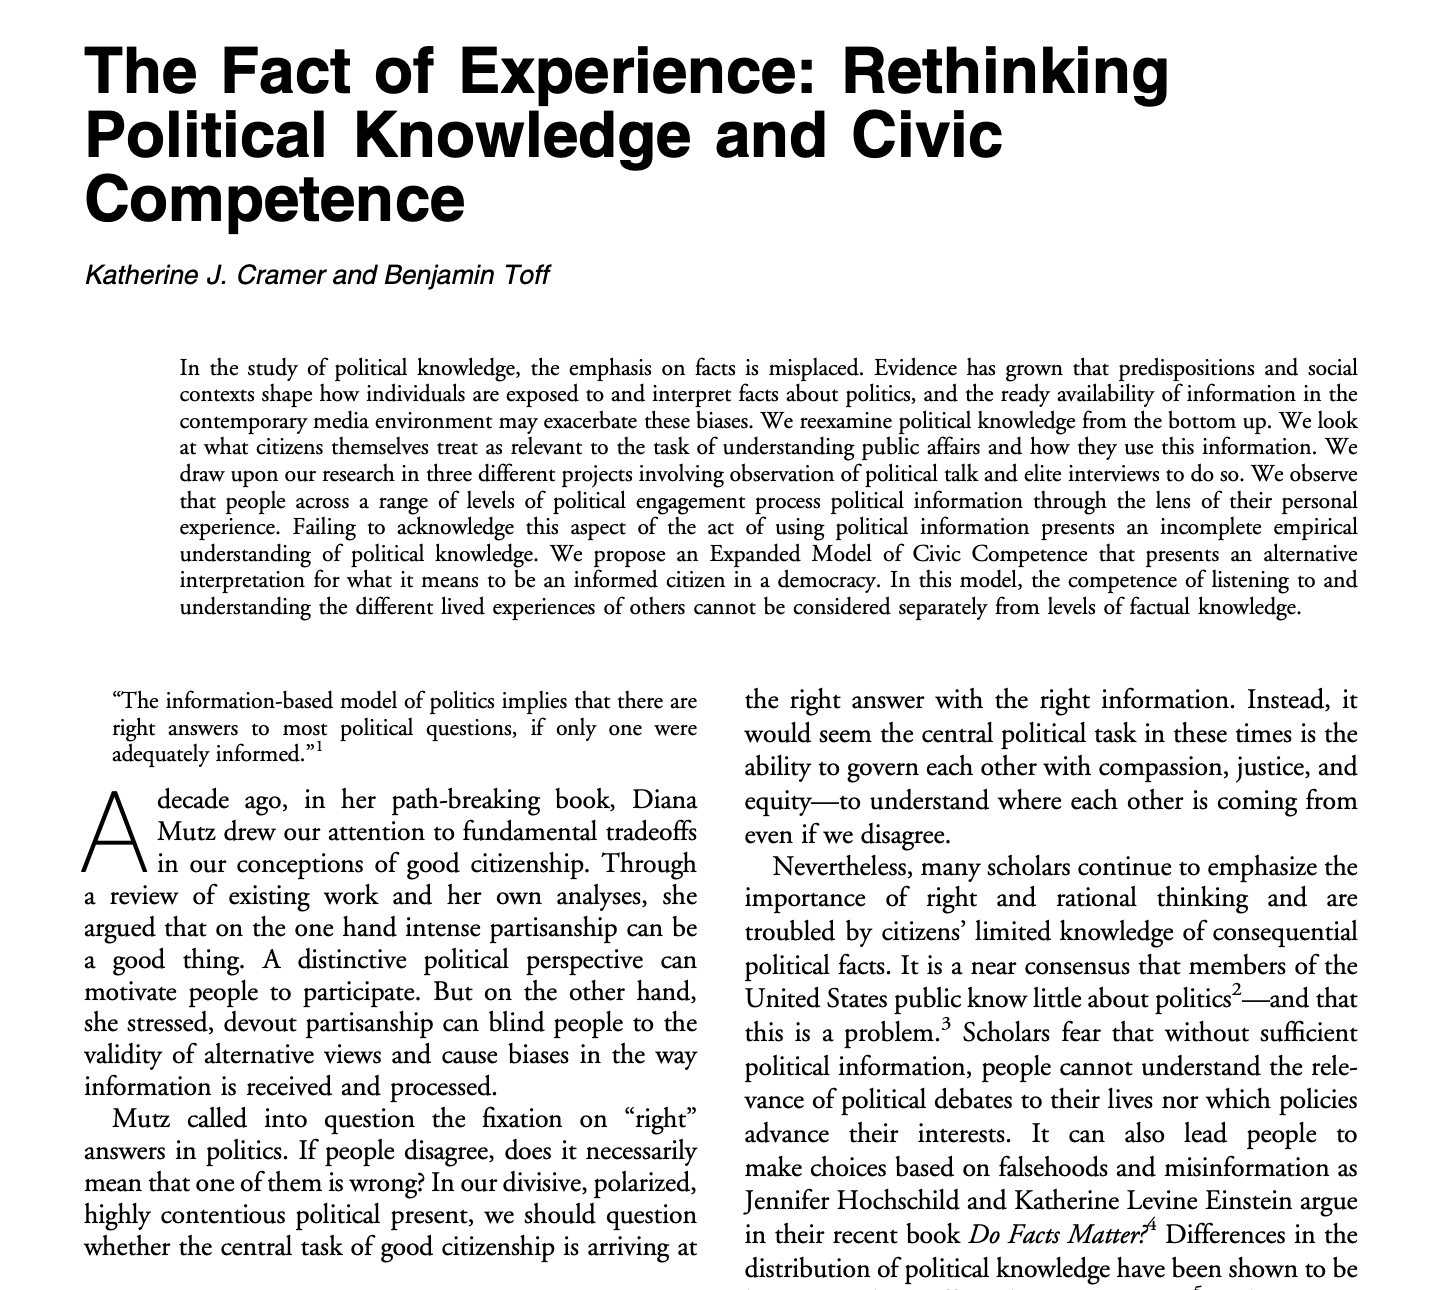
Following Cramer and Toff (2017) they think of political knowledge in terms of people’s lived experiences
Civic competence depends less on factual recall and more on how people interpret and deploy political experience
What’s the empirical design
 - 233 conversations between Black residents across 13 highly policed neighborhoods
- Interpretive, inductive analysis of dialogue
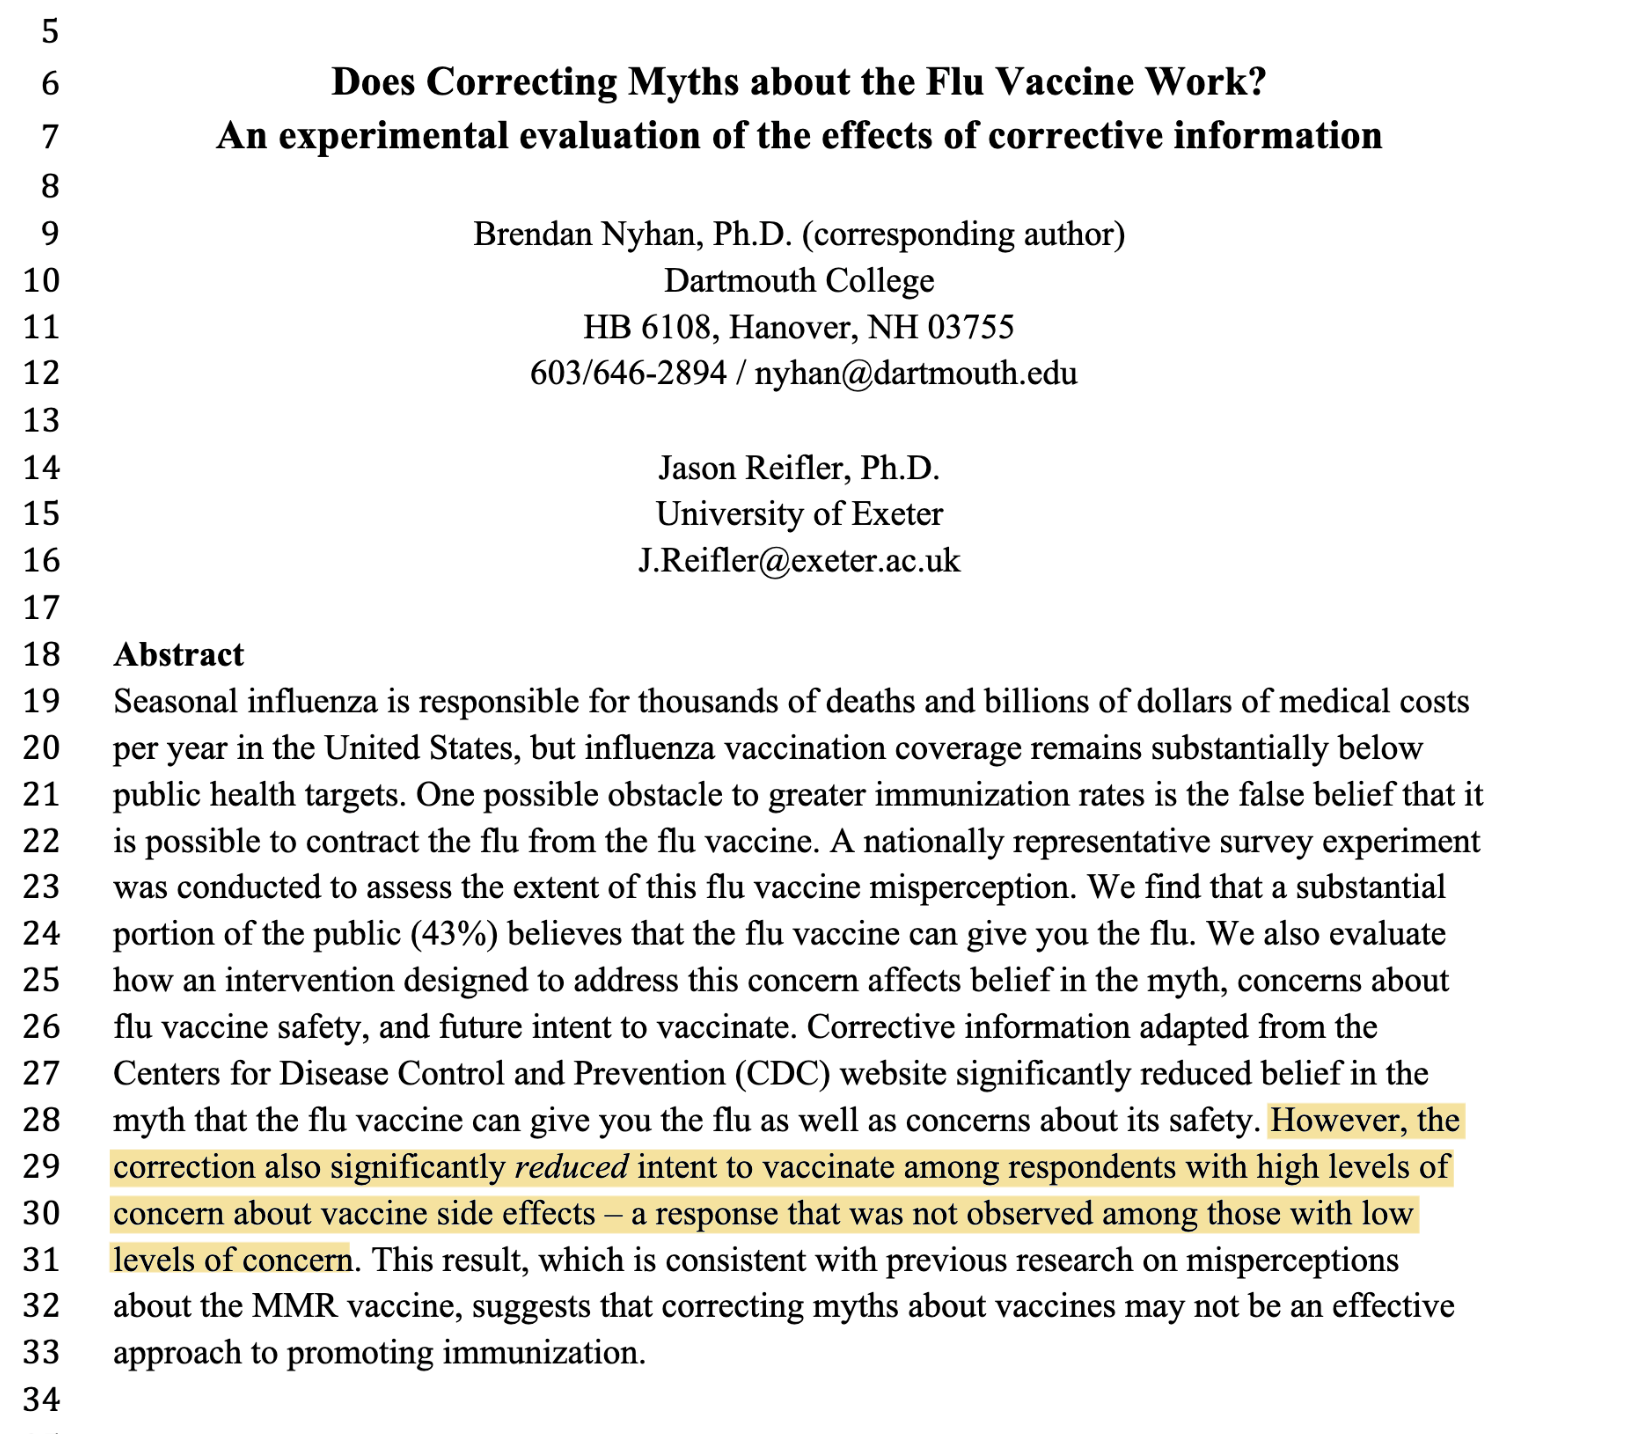
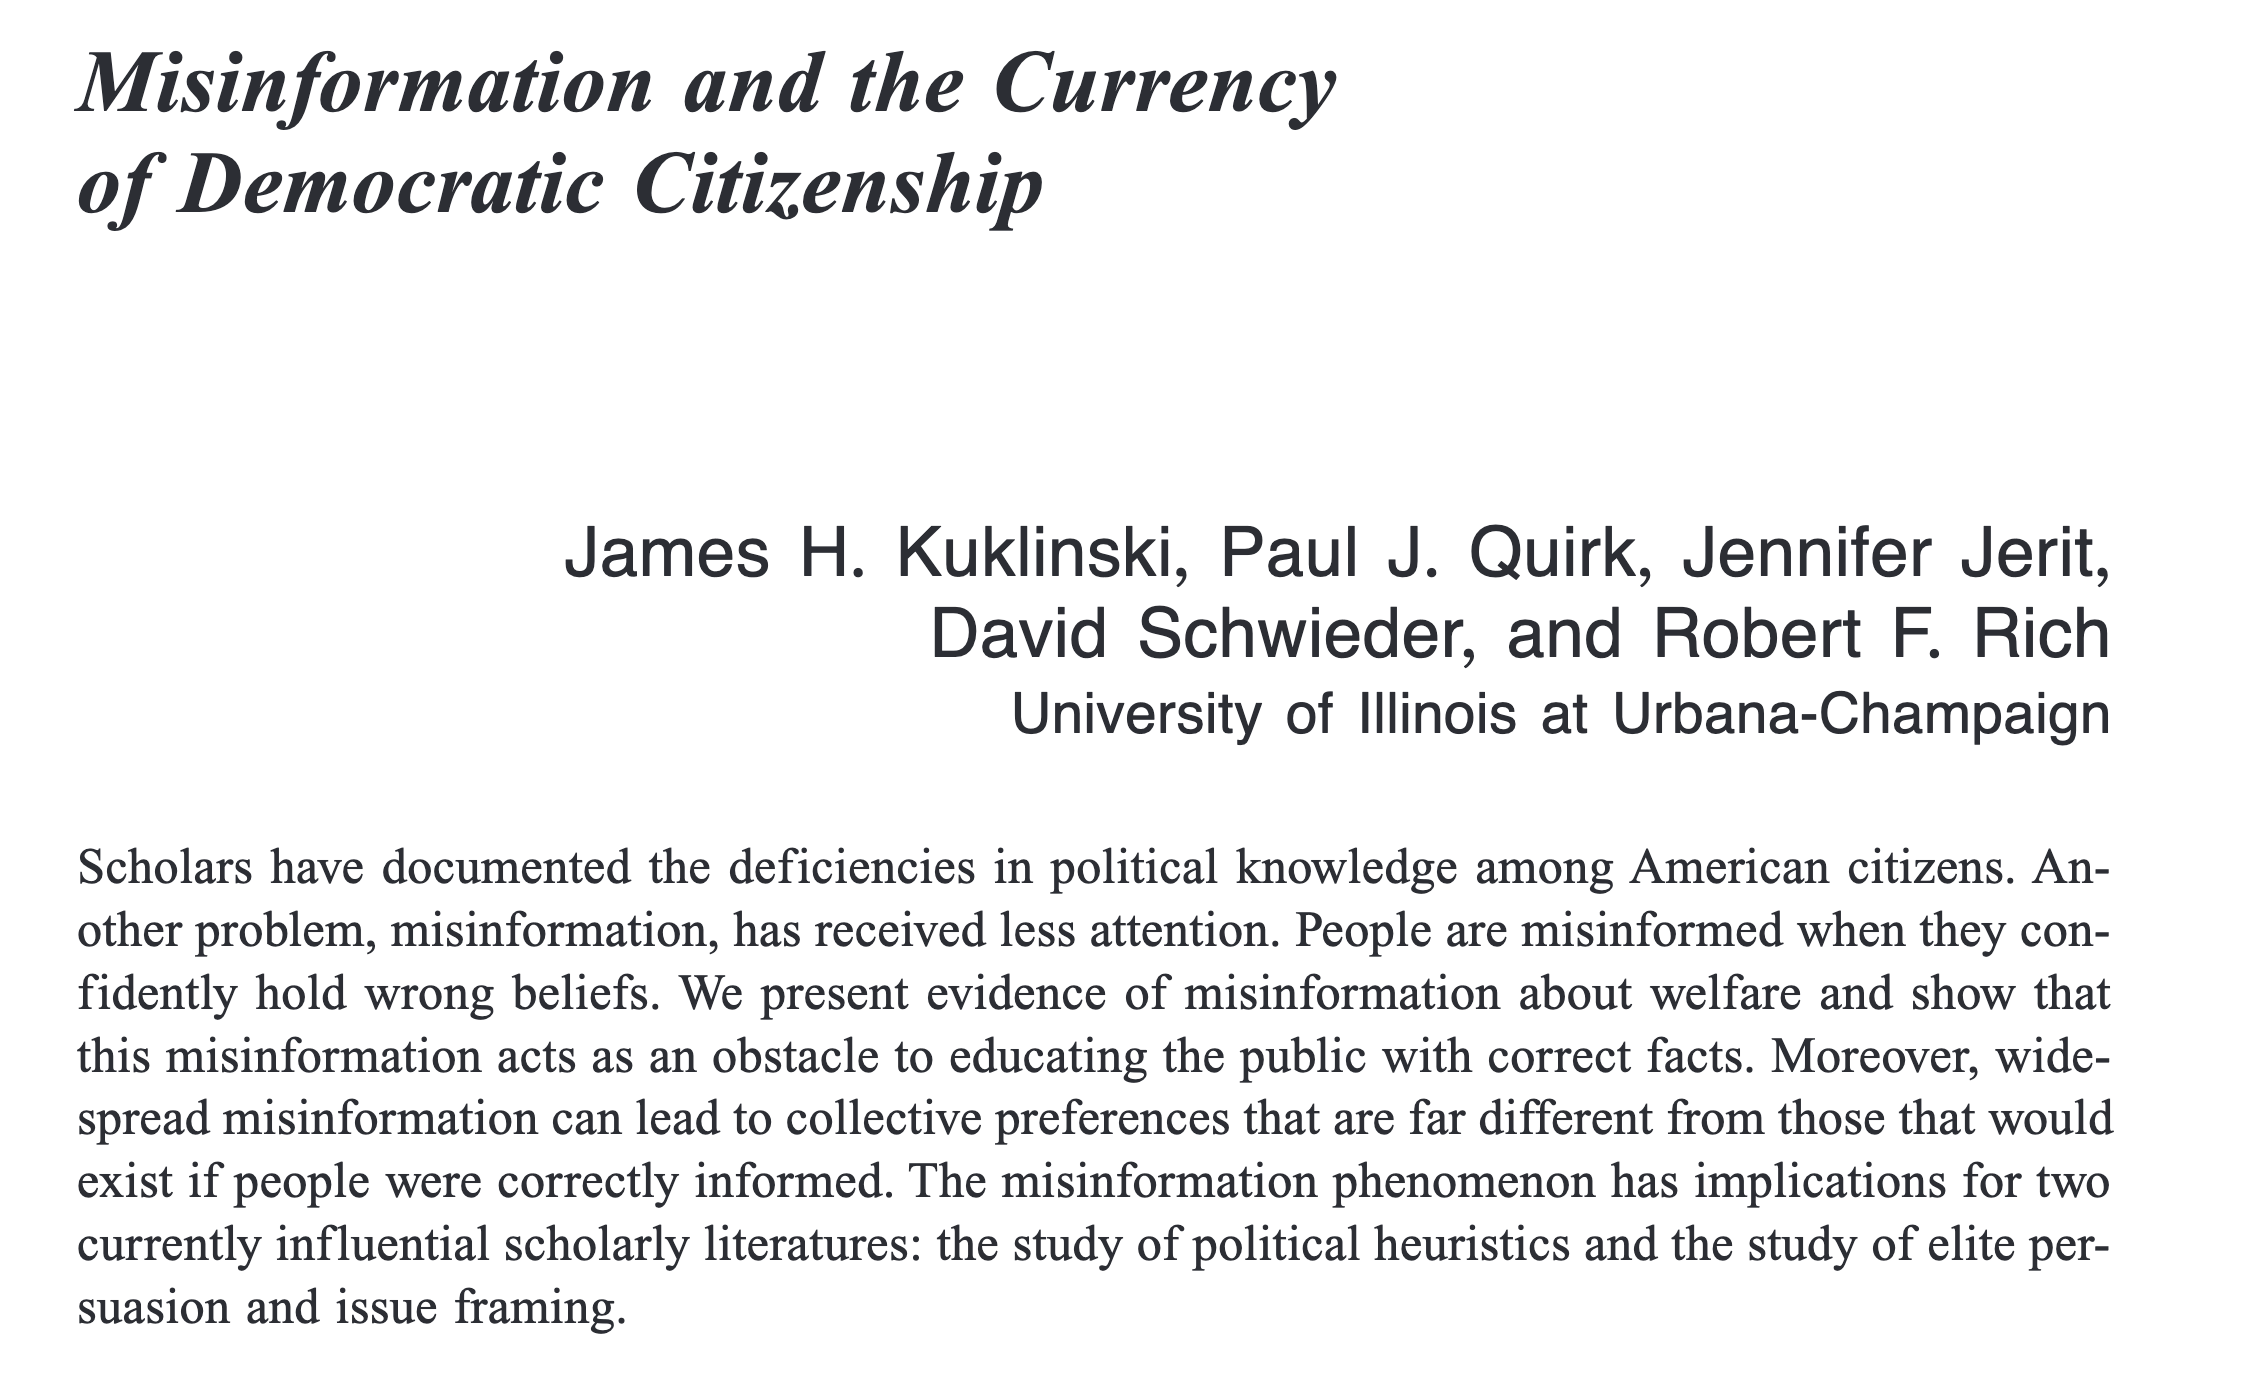
What is misinformation
- Kuklinski et al. (2000): “People are misinformed when they confidently hold wrong beliefs”
Rumors
Lack evidentiary standards
May turn out to be true
Conspiracy beliefs
Explain events via hidden, powerful actors
Often tied to dispositional predispositions
Misinformation
Unambiguously false
Confidently held
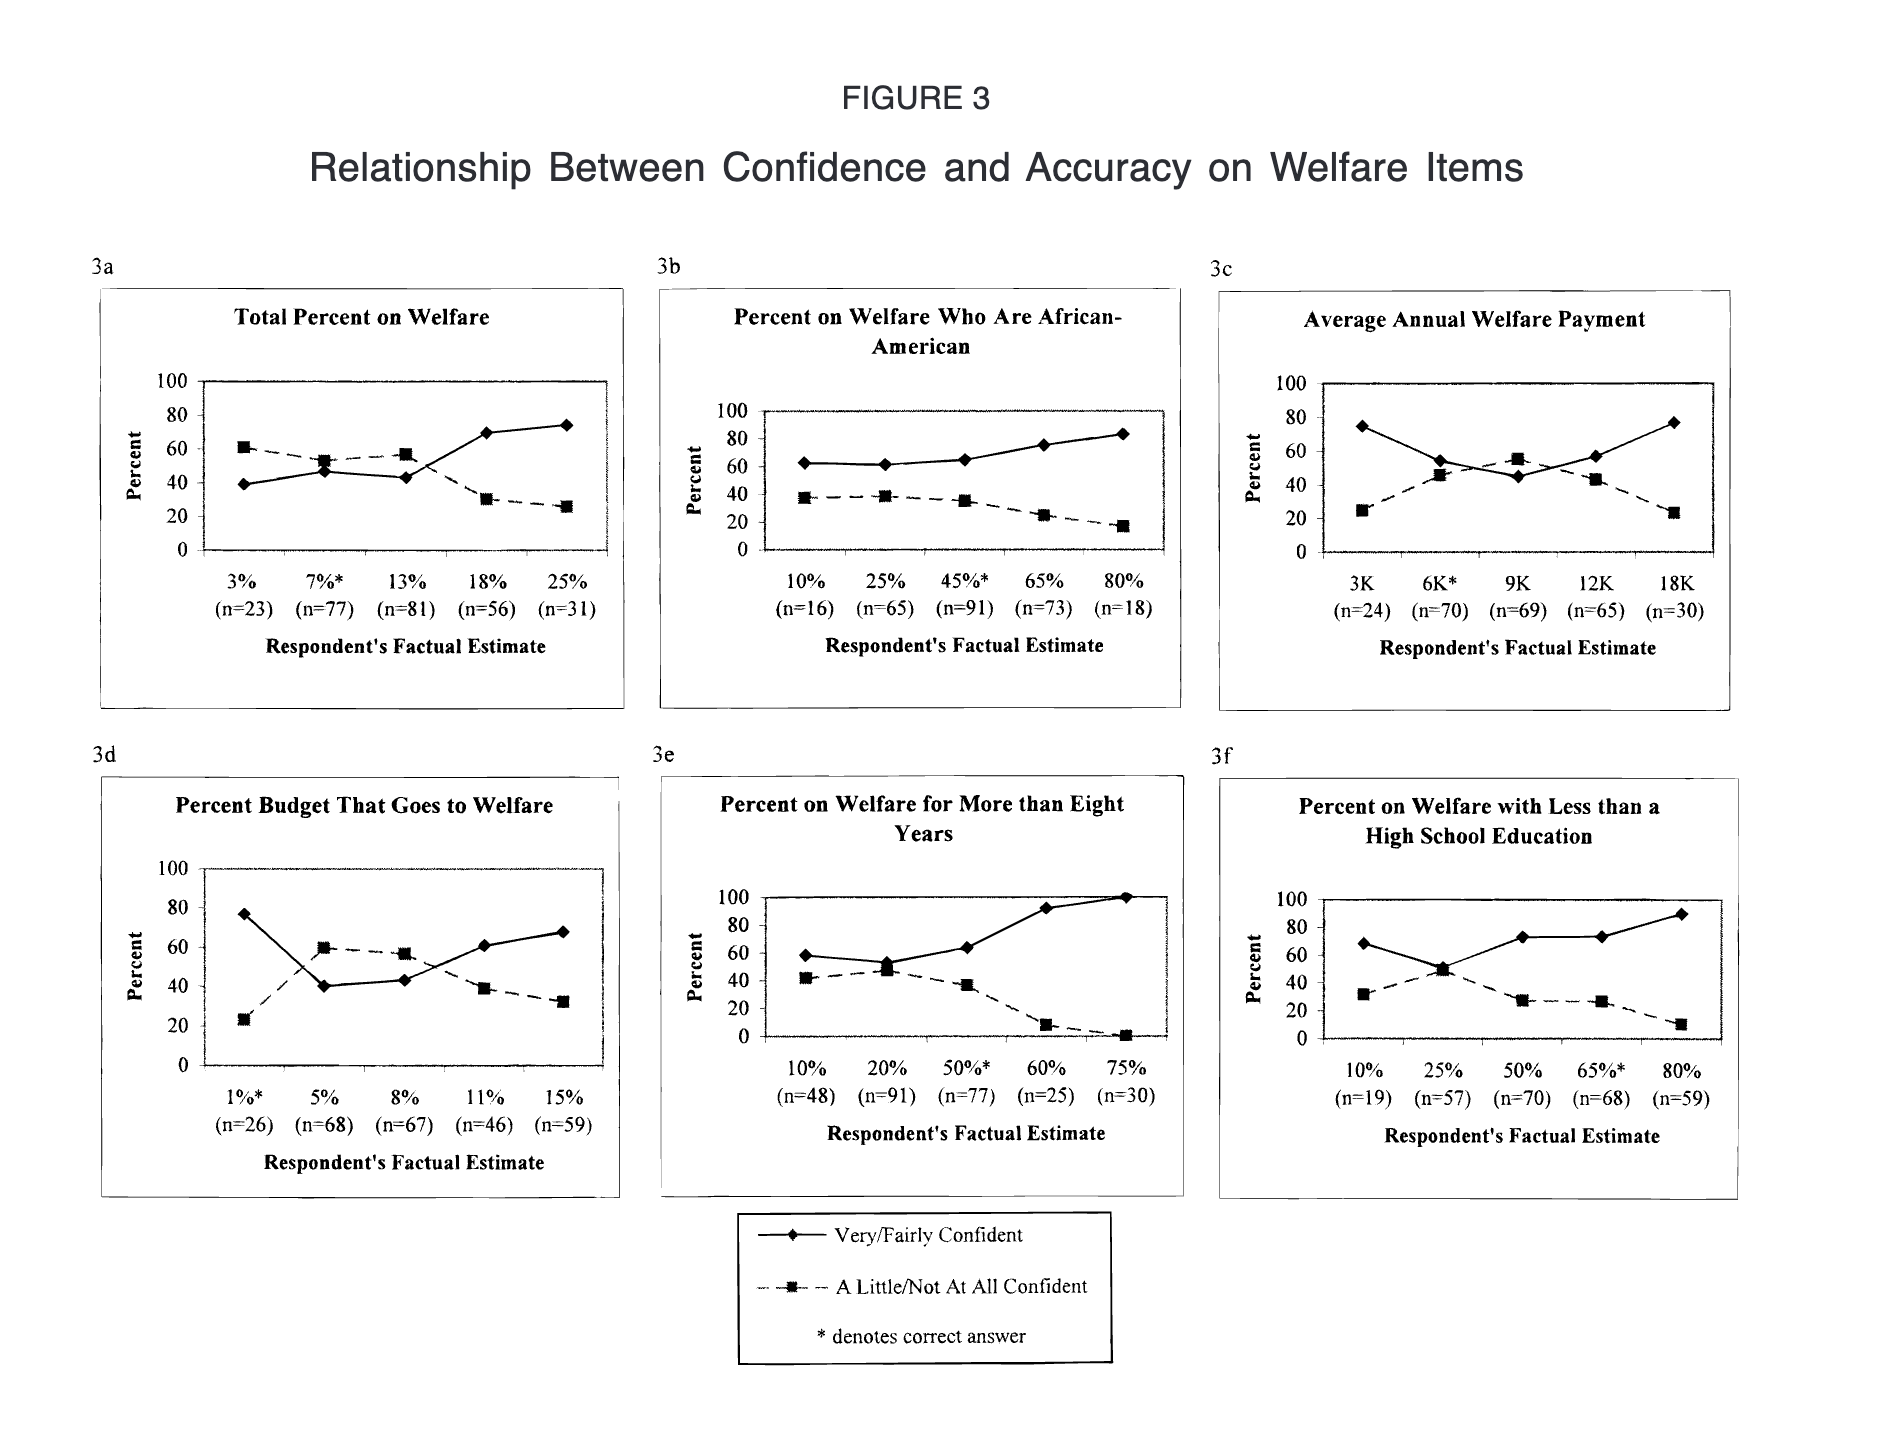
Intrepetation:
- The people who give the most inflated, factually wrong answers are often the most confident.