Call:
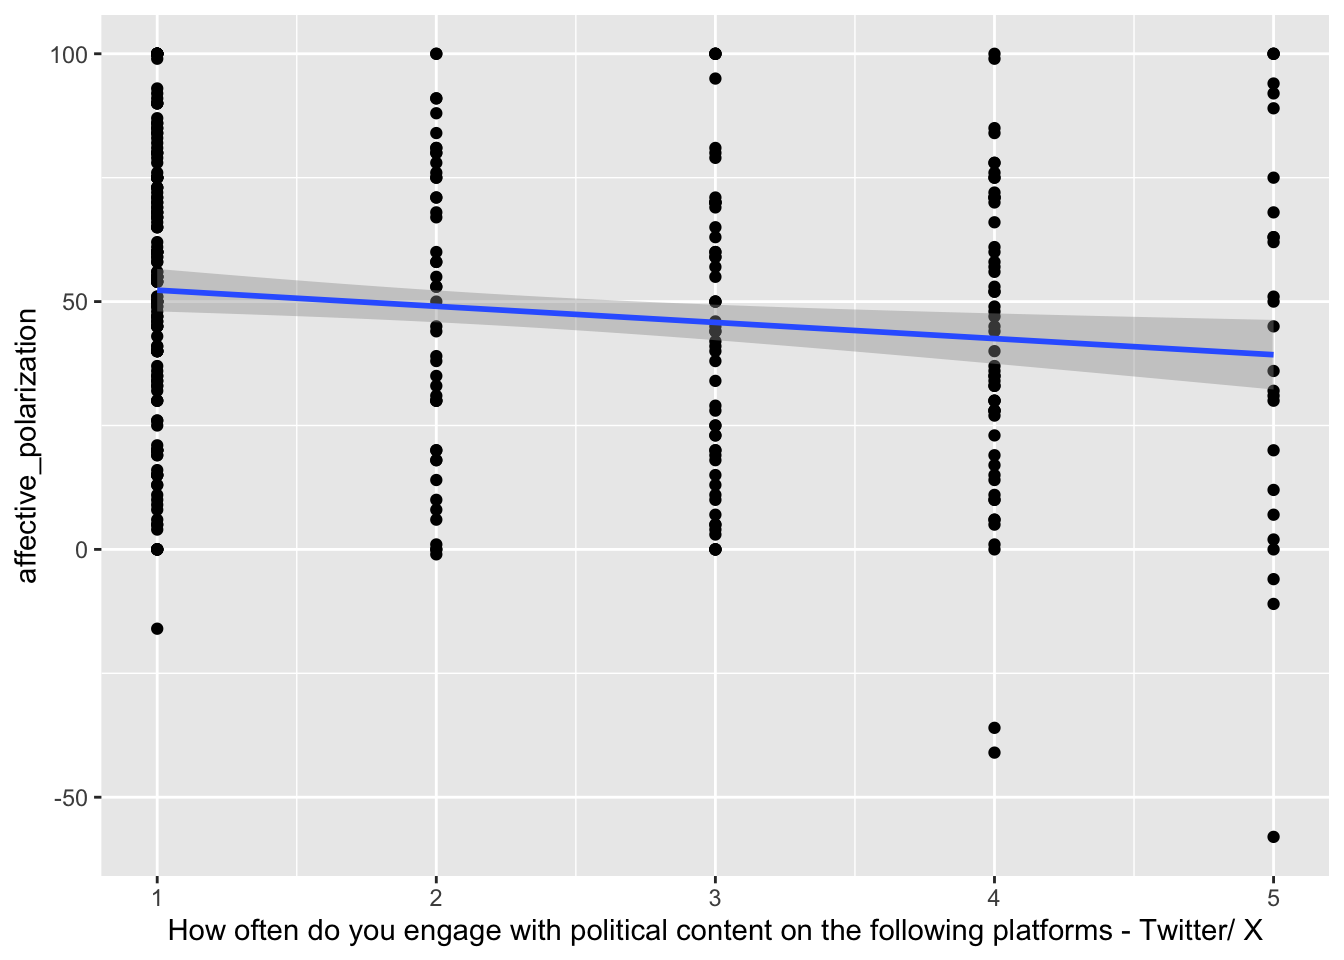
lm(formula = affective_polarization ~ sm_political_twitter, data = df)
Residuals:
Min 1Q Median 3Q Max
-97.281 -22.303 1.464 22.964 60.719
Coefficients:
Estimate Std. Error t value Pr(>|t|)
(Intercept) 55.559 3.092 17.971 < 2e-16 ***
sm_political_twitter -3.256 1.166 -2.791 0.00554 **
---
Signif. codes: 0 '***' 0.001 '**' 0.01 '*' 0.05 '.' 0.1 ' ' 1
Residual standard error: 29.91 on 345 degrees of freedom
(56 observations deleted due to missingness)
Multiple R-squared: 0.02209, Adjusted R-squared: 0.01925
F-statistic: 7.791 on 1 and 345 DF, p-value: 0.005541POLS 1140
Class Survey
Updated Apr 13, 2026
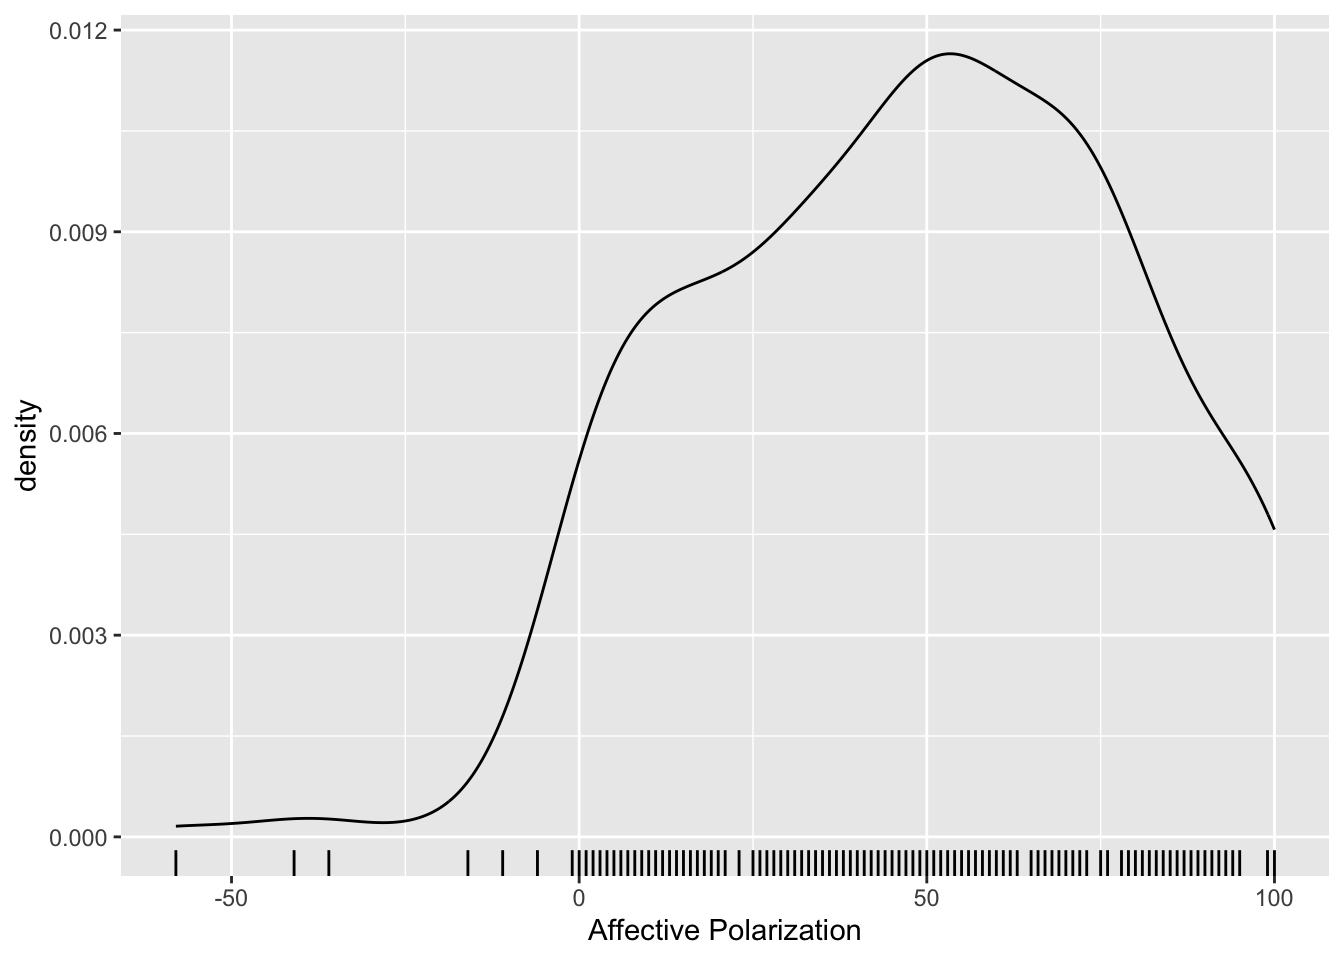
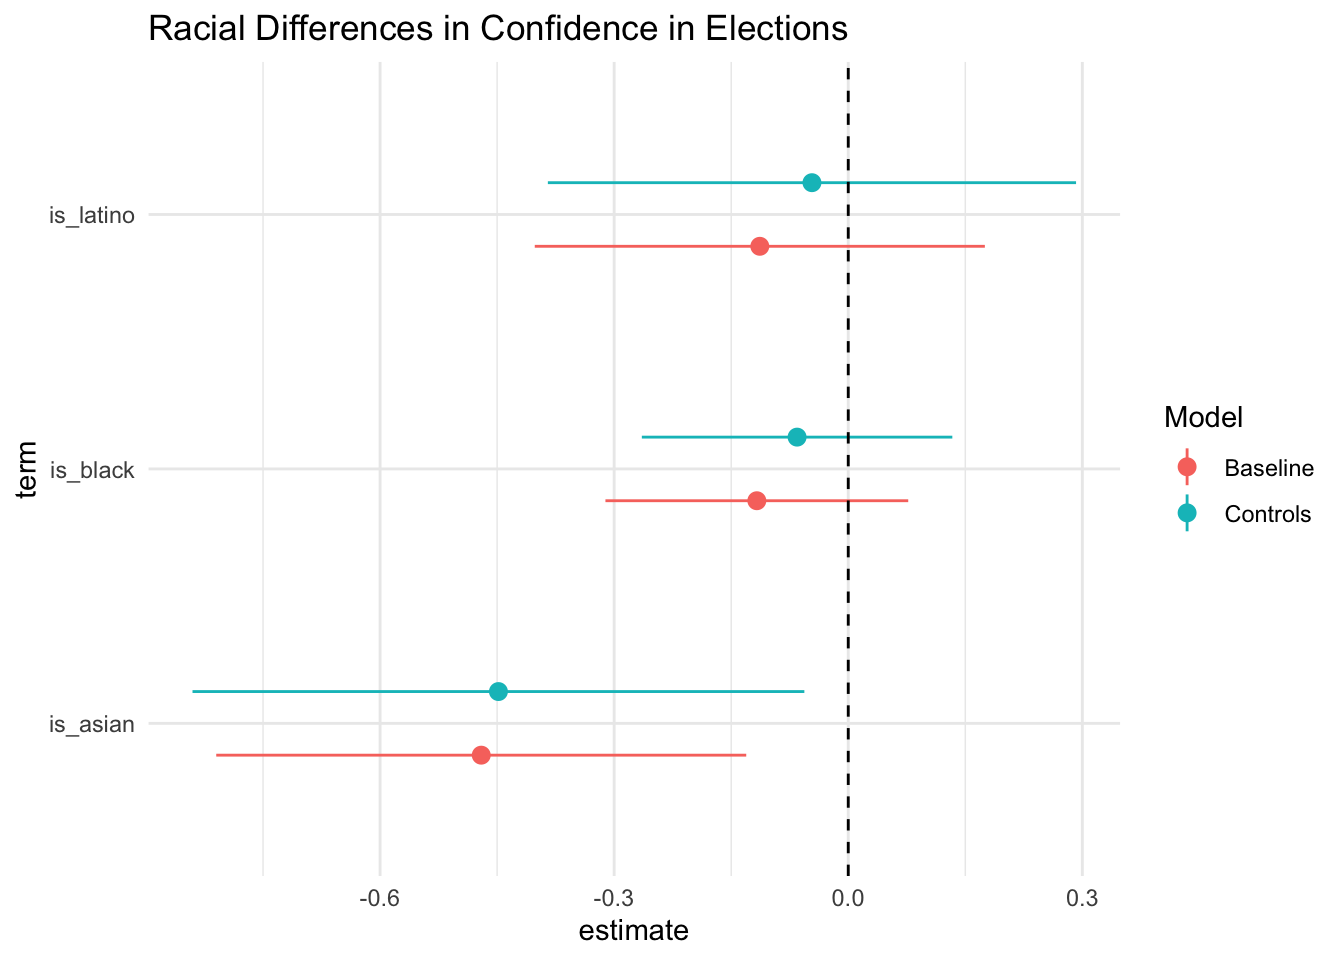
Affective Polarization
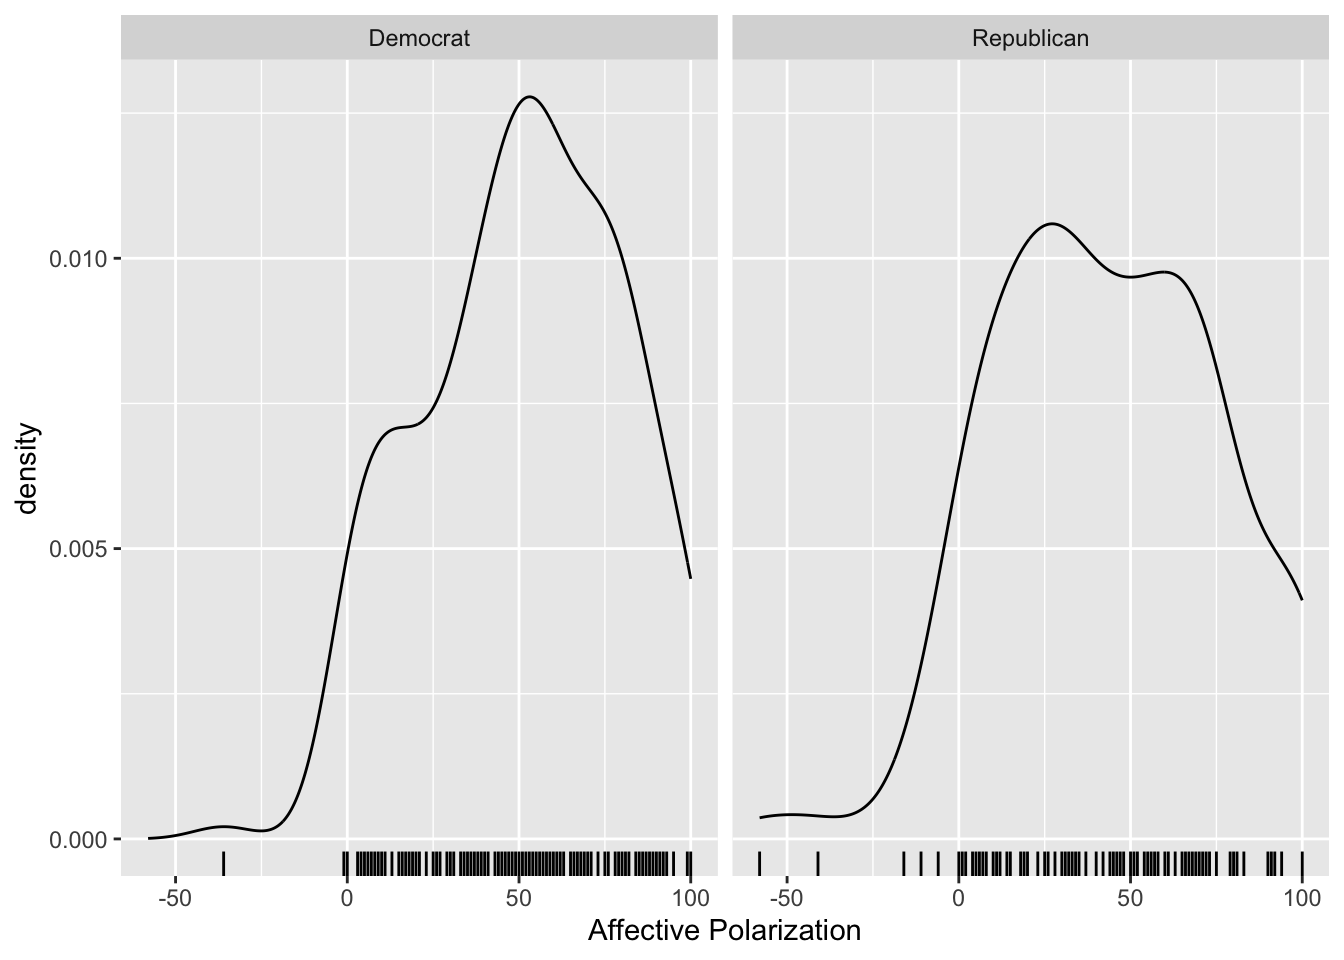
Affective Polarization by Partisanship
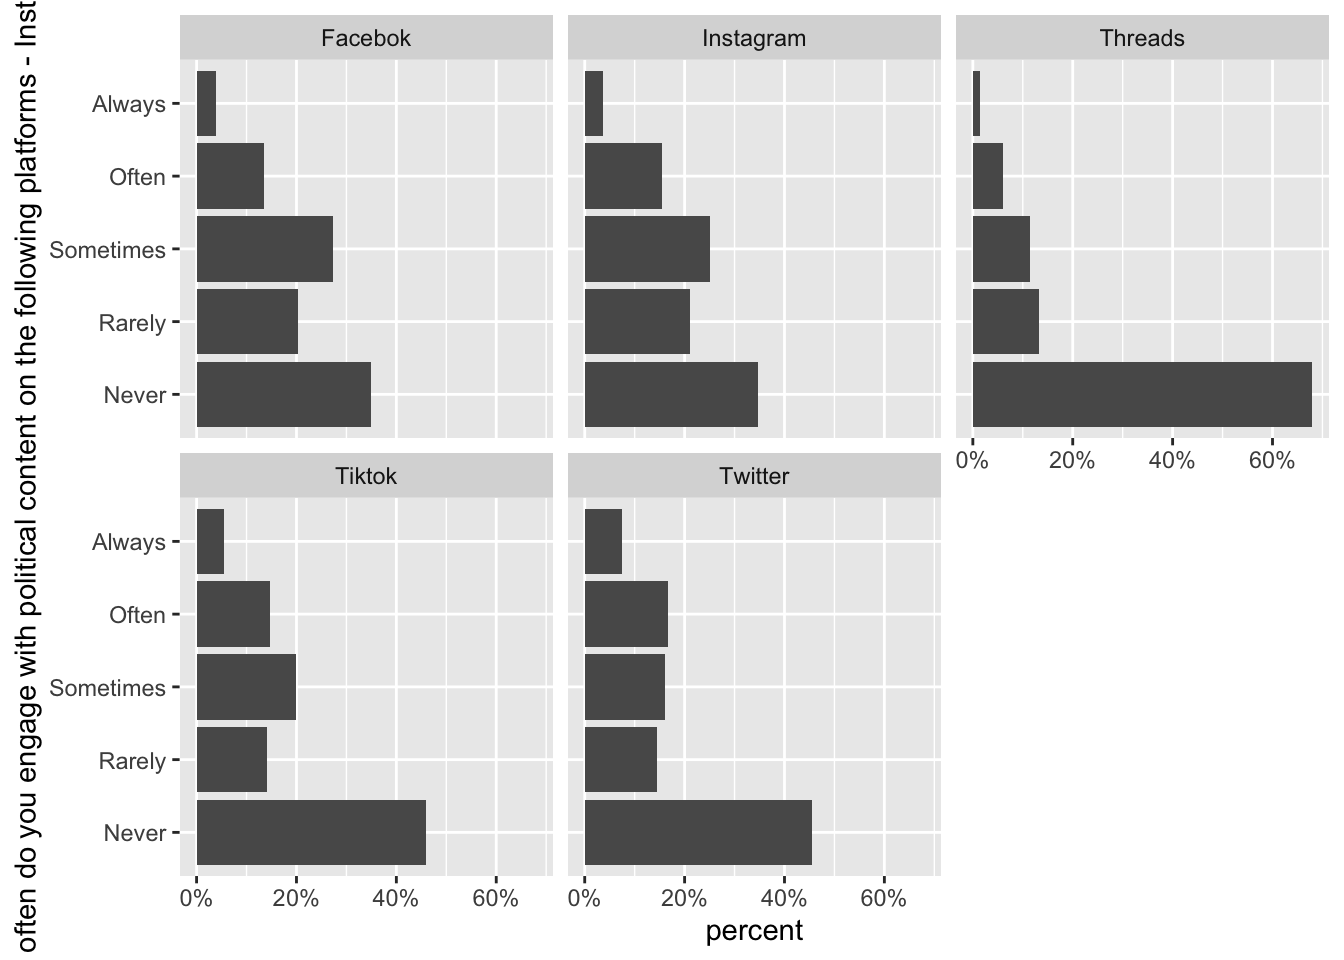
Engage with poltical content
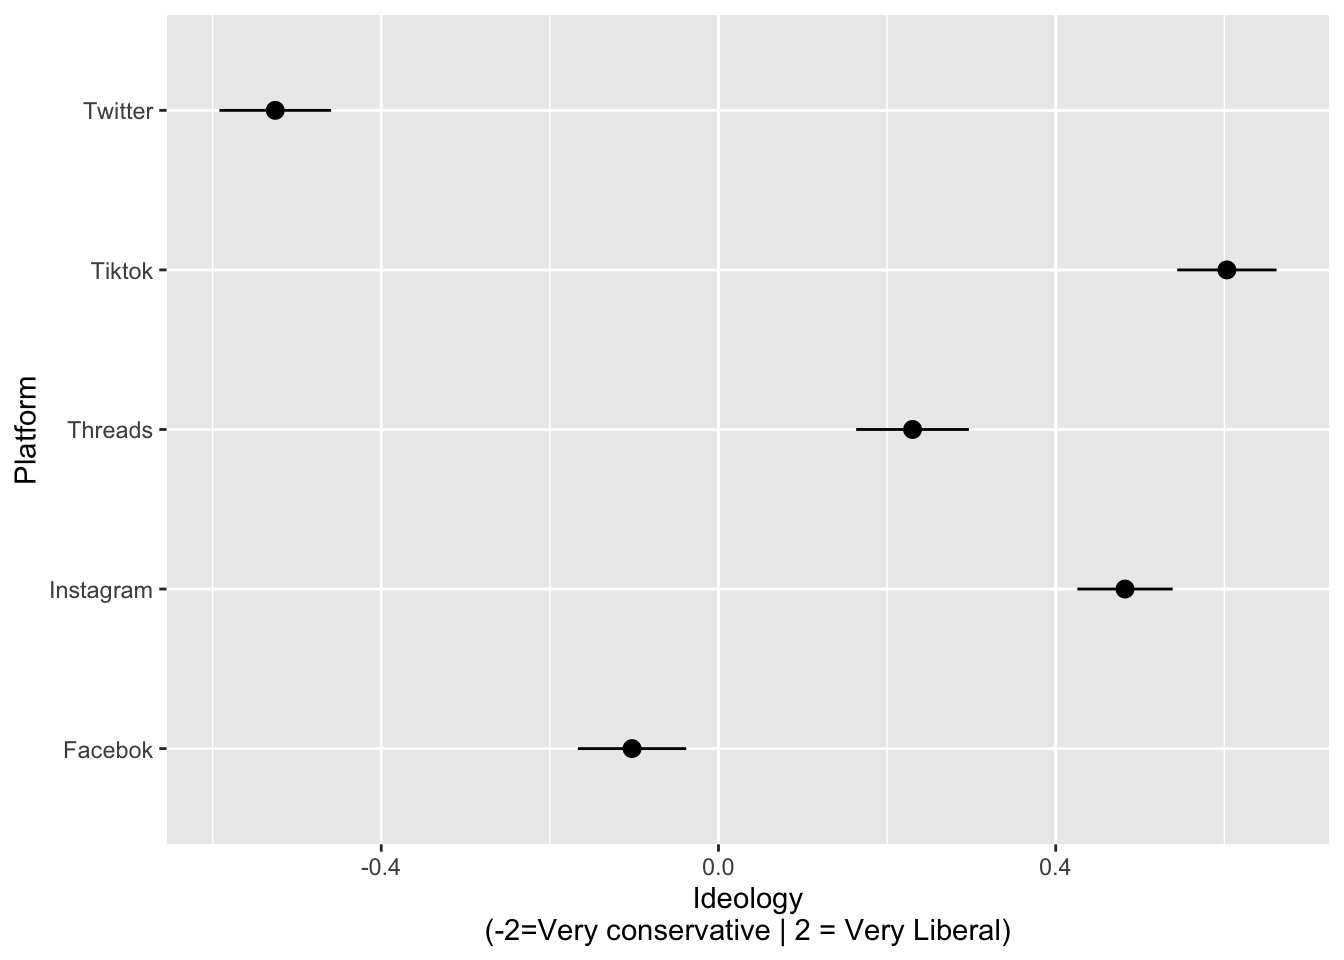
Perceived Ideology
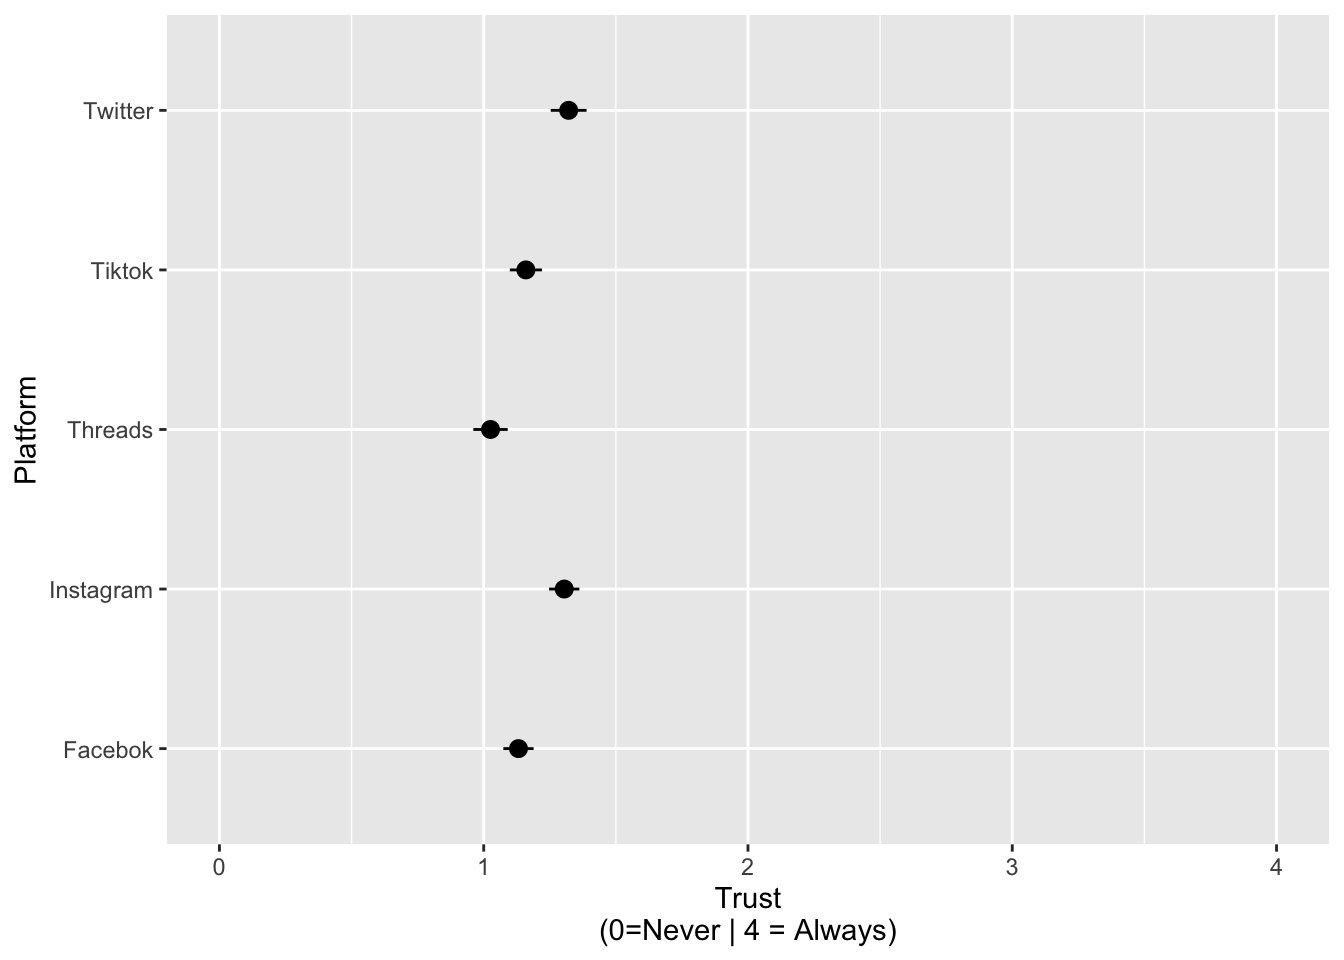
Trust in content by platform
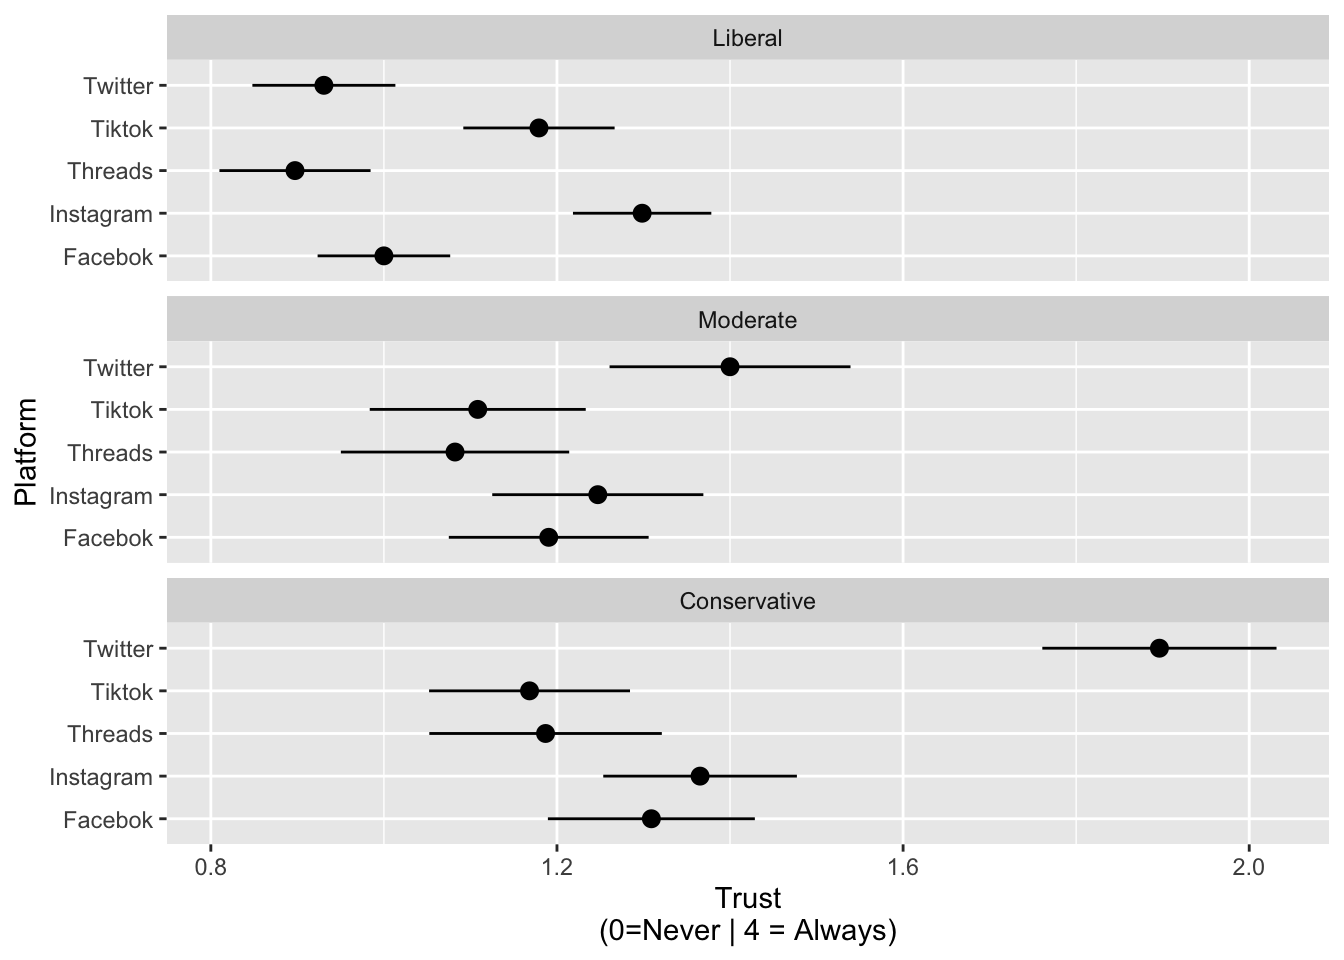
Trust in content by platform and ideolgoy
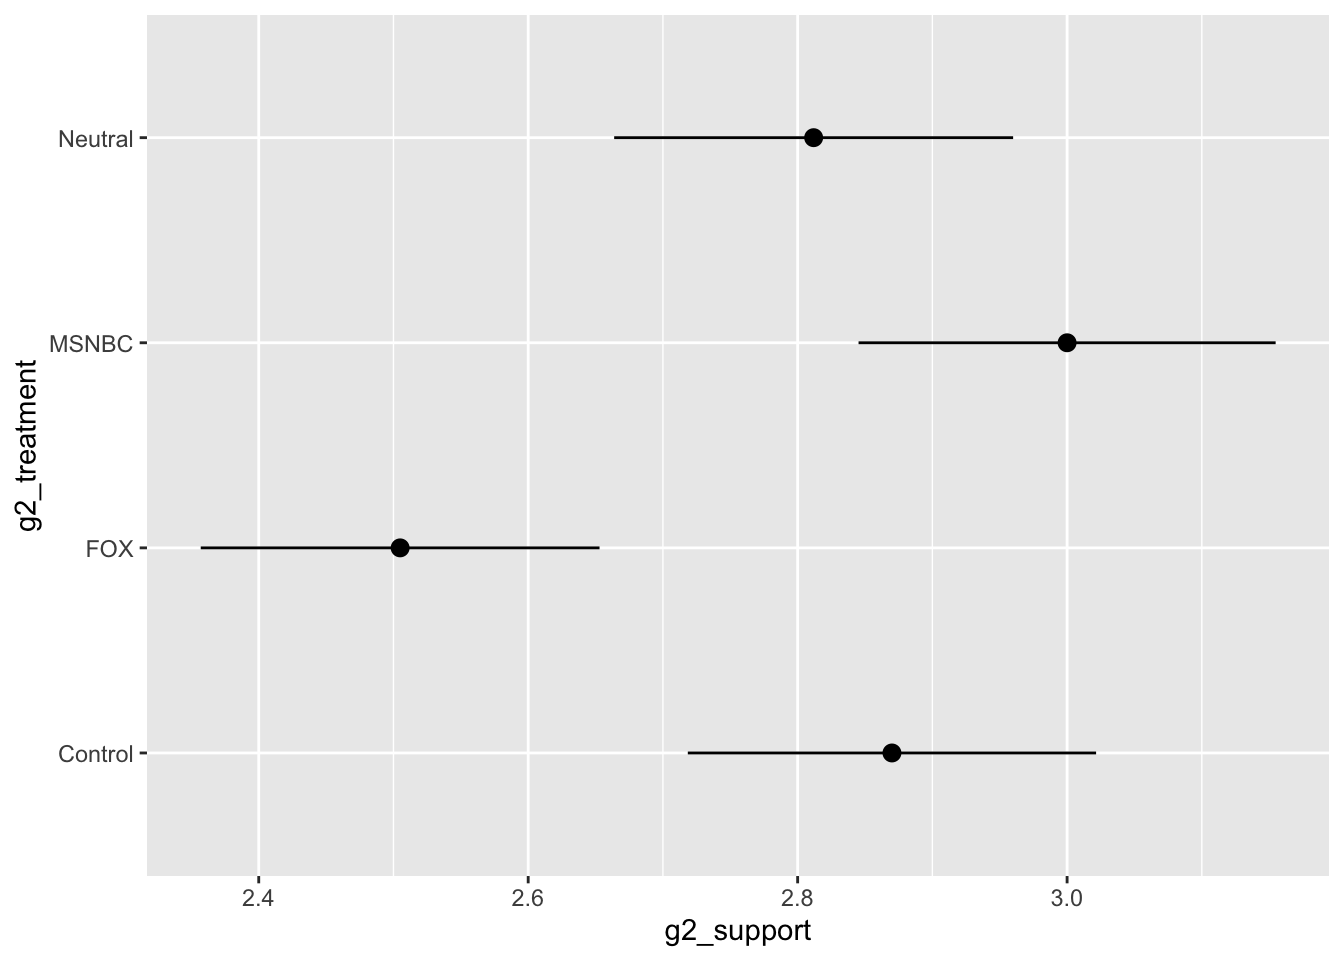
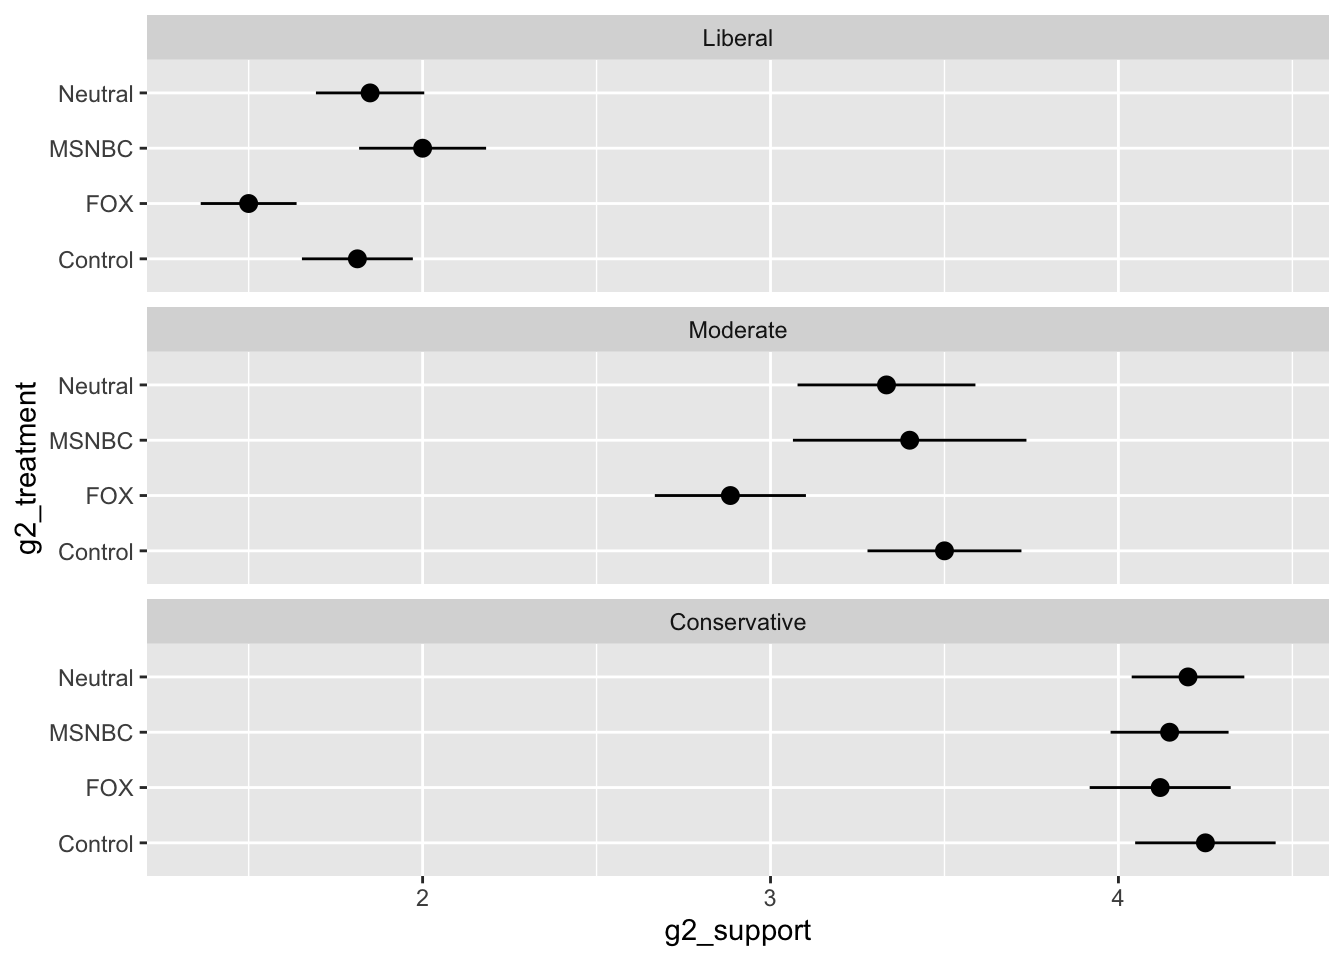
Media Use and Affective polarization
Results
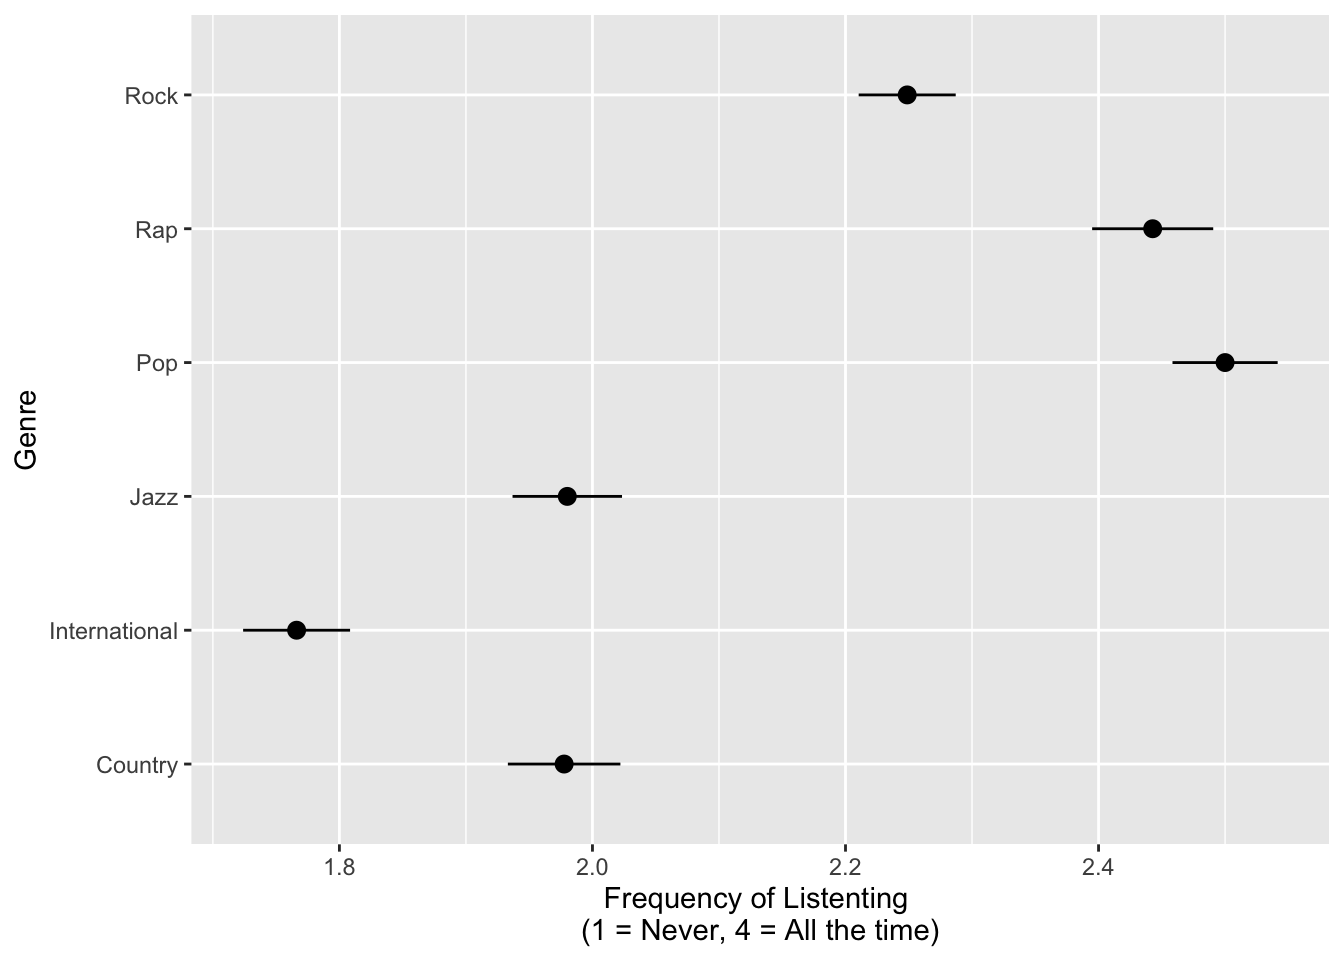
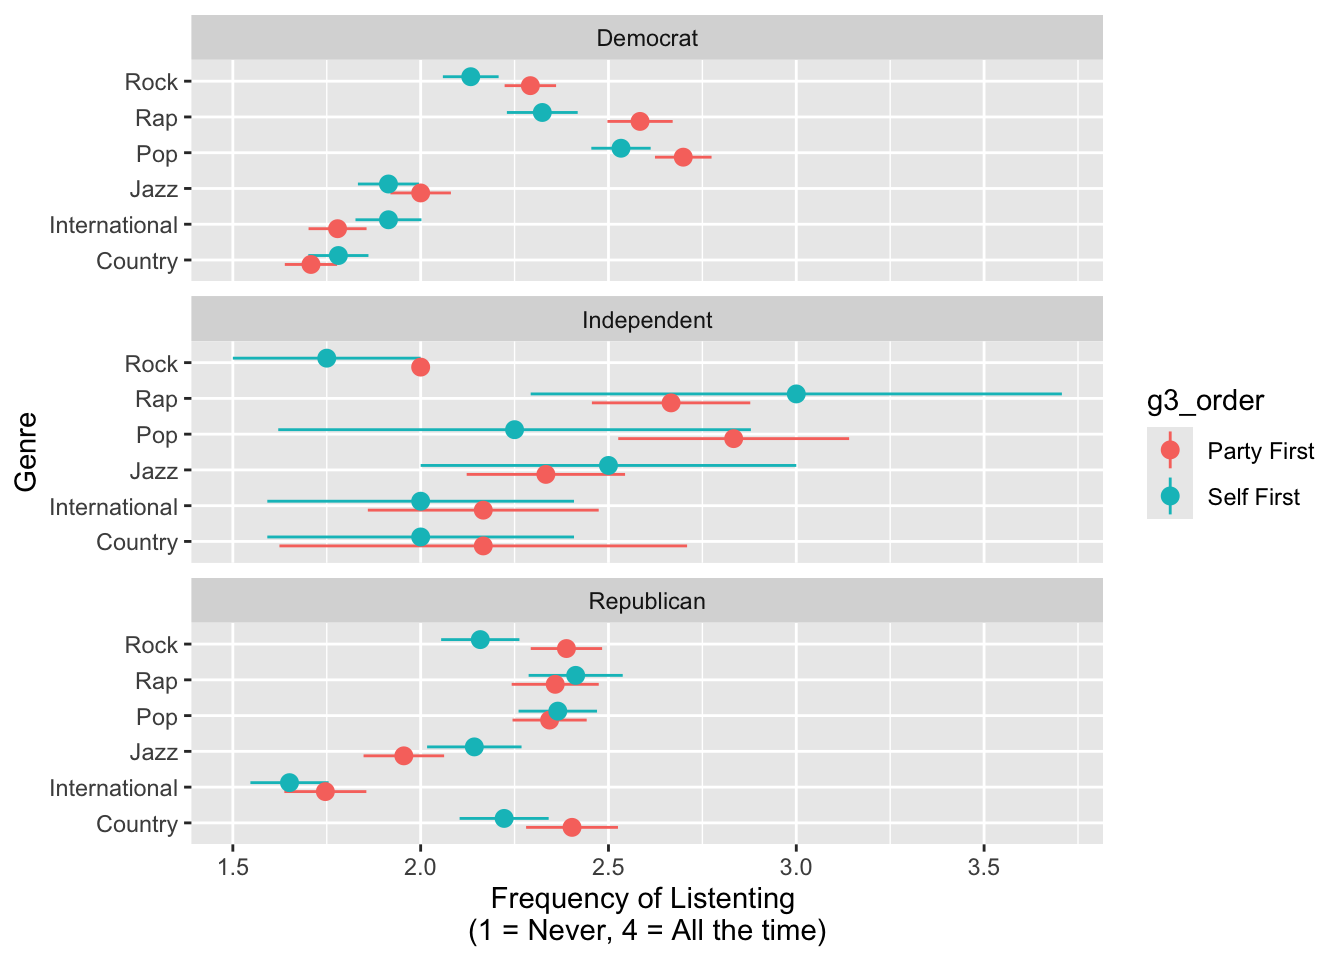
Listening Preferences
Listening Preferences by Partisanship
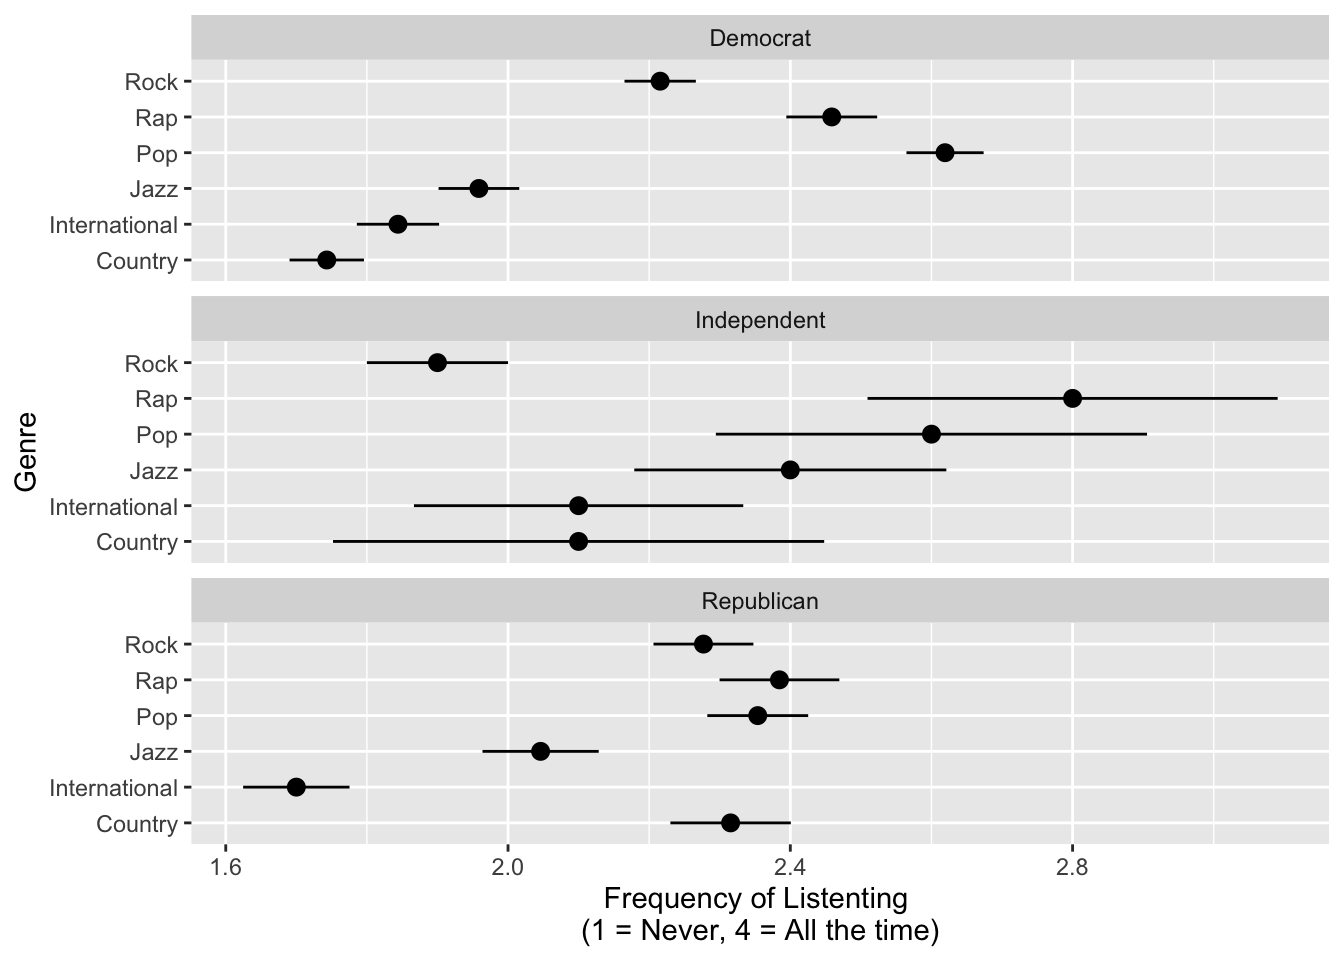
Listening Preferences by Partisanship and Order
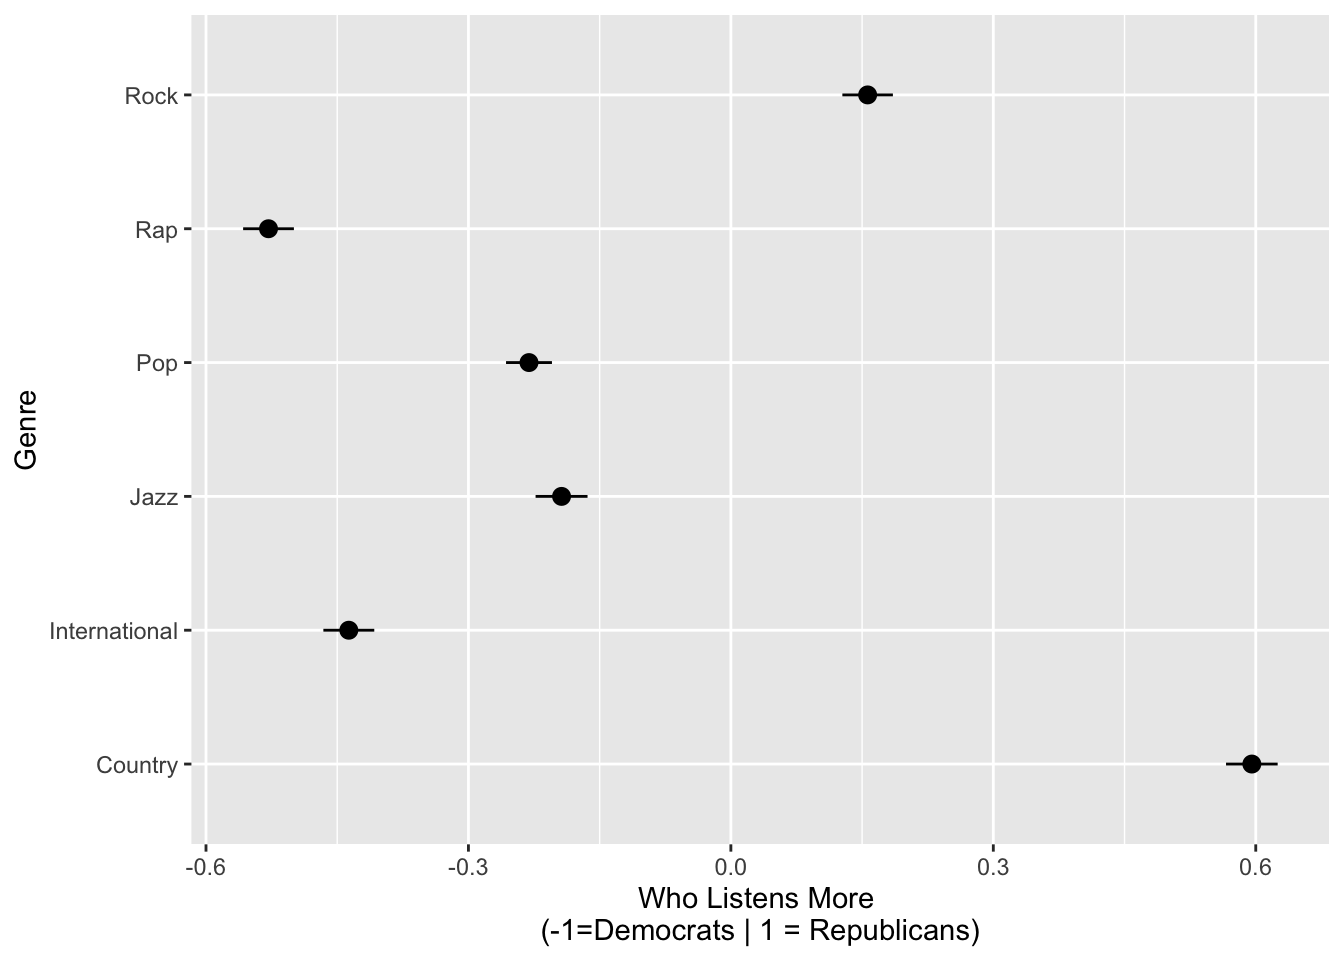
Perceived Partisanship of Genre’s Listeners
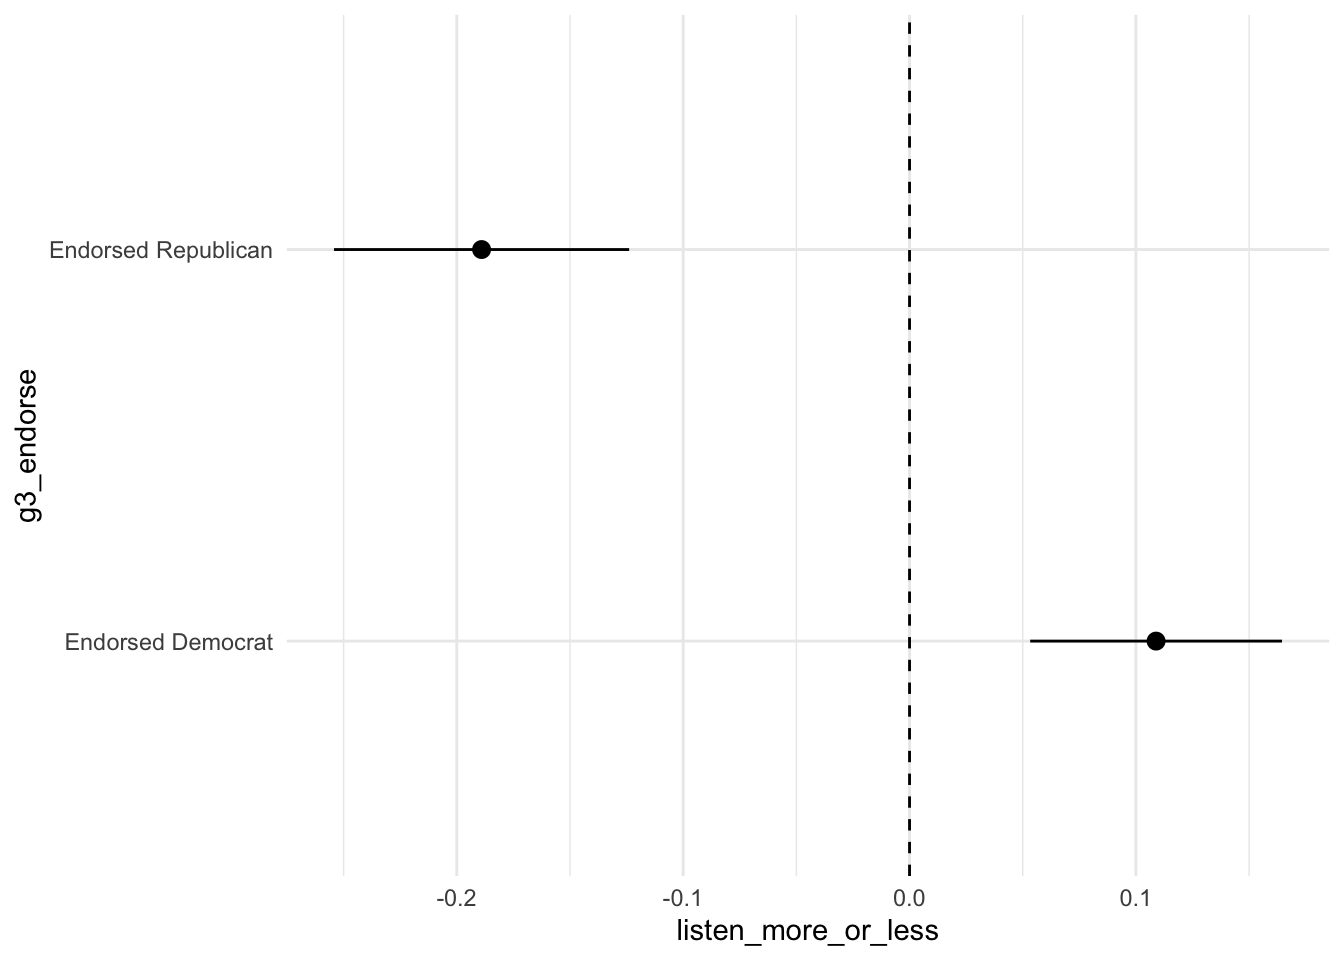
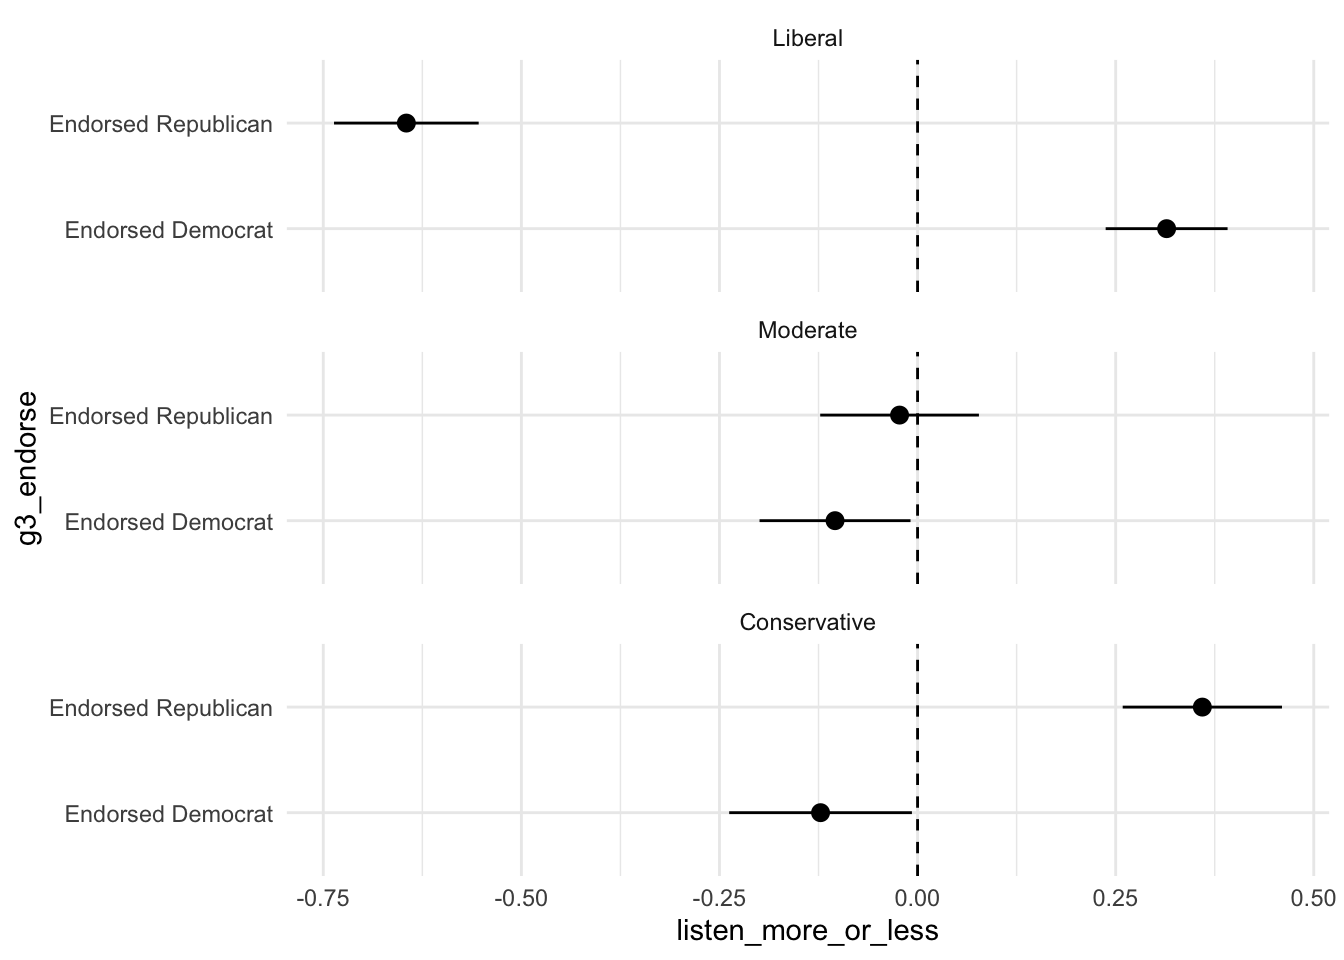
What if favorite musician endorsed: Democrat/Republican
By ideolgoy
Coefficient plots
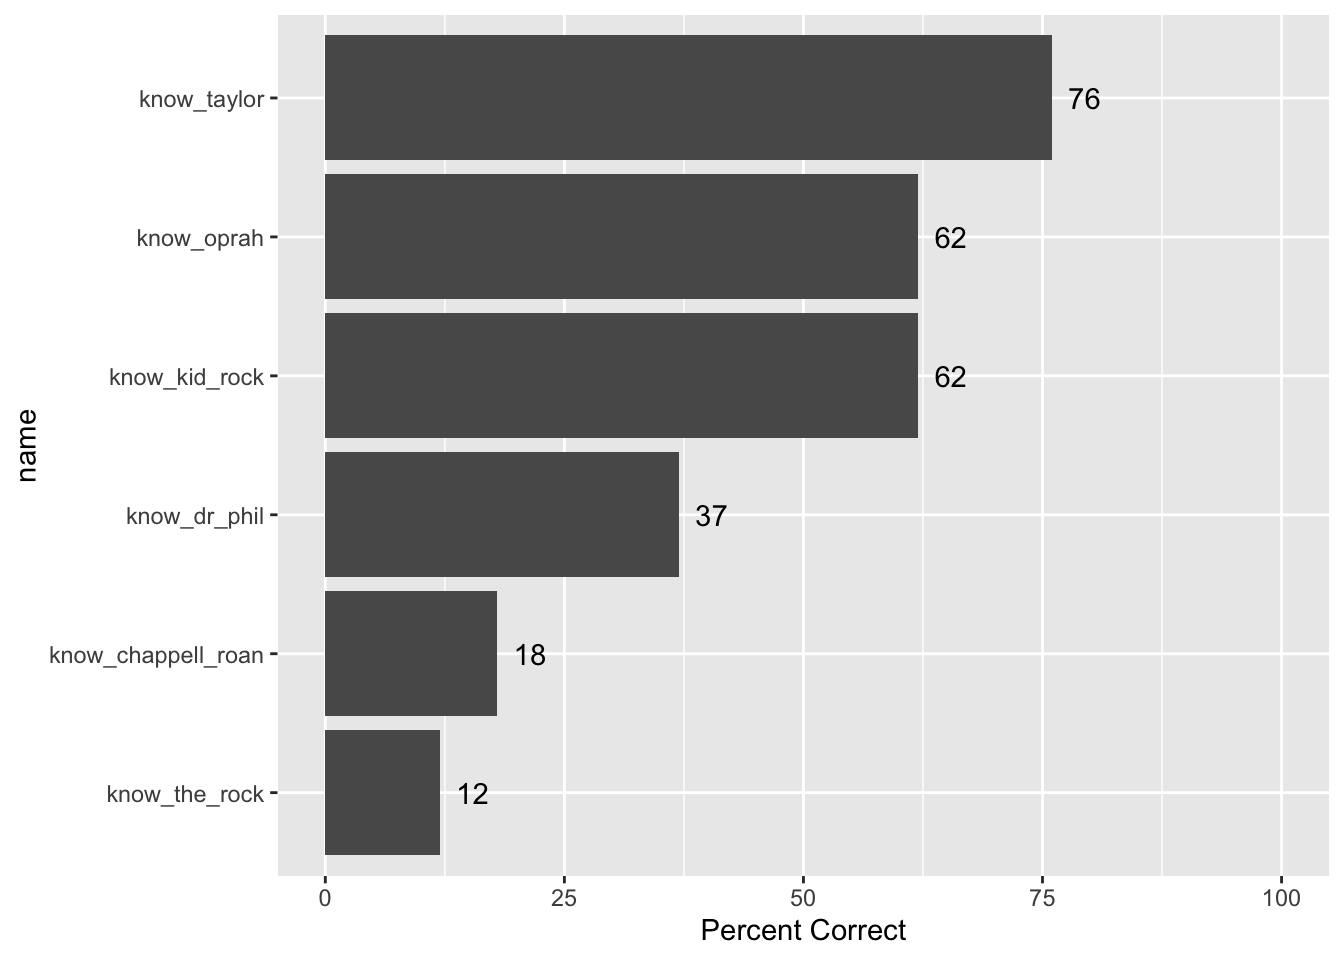
Knowledge of Celebrity Endorsements
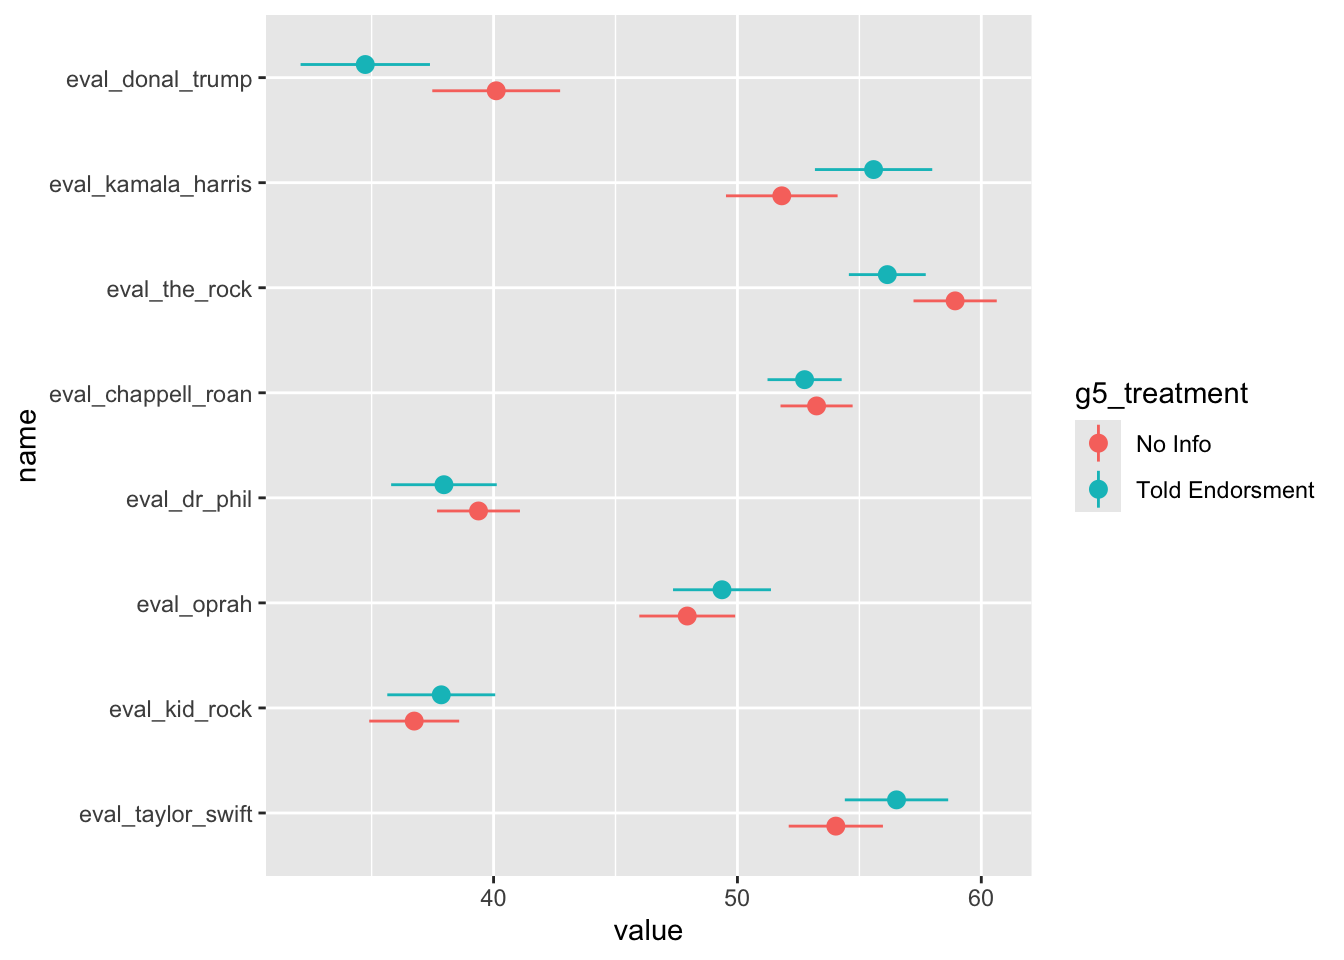
Impact of Knowing Celebrity Endorsments
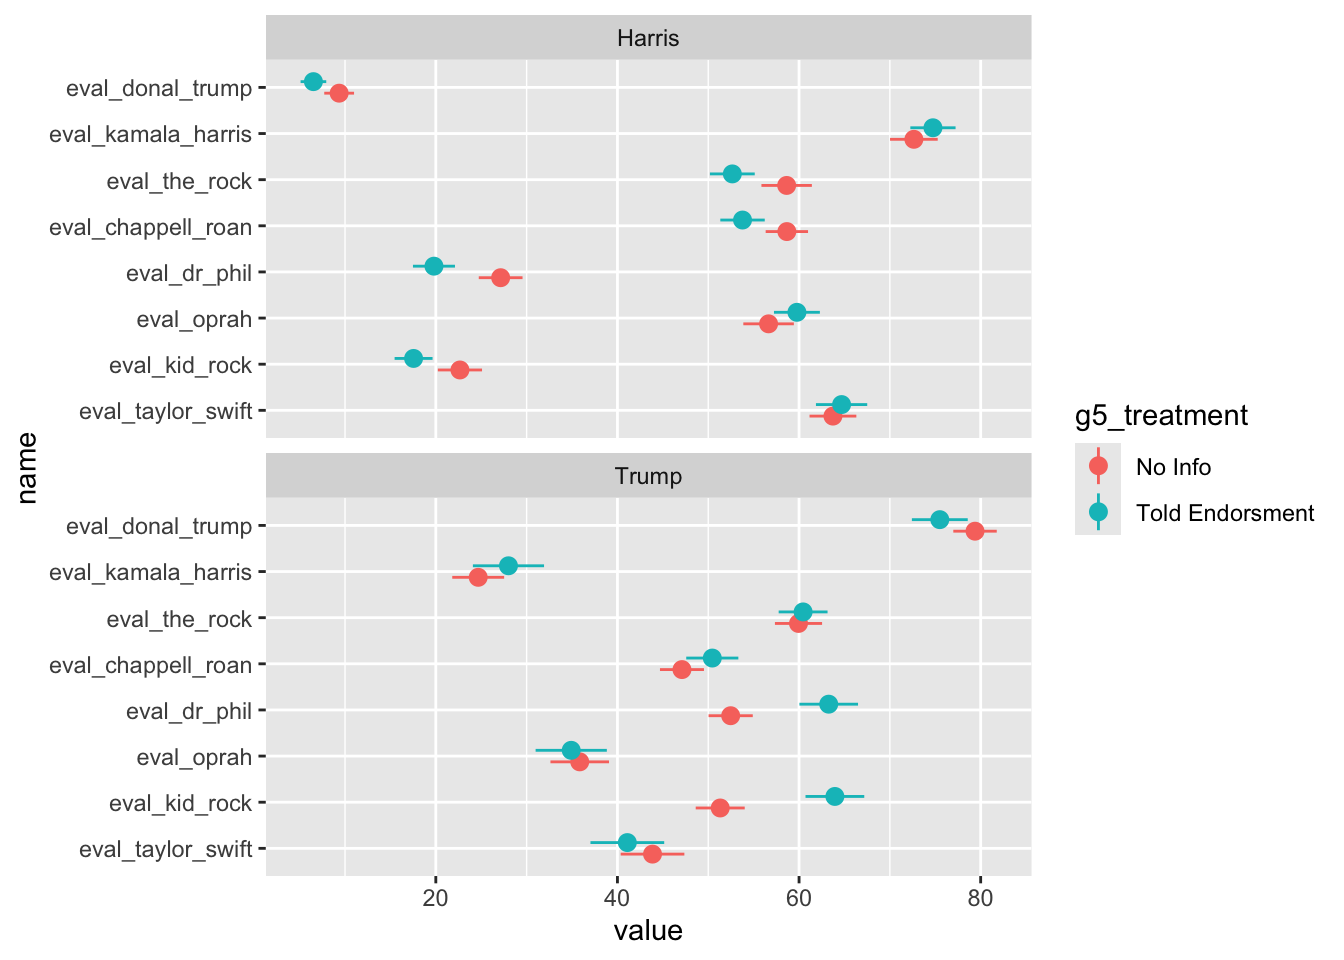
Impact of Knowing Celebrity Endorsments by Vote Choice
Data
Error in reverse_zipcode(df$zipcode[i]) :
  Invalid ZIP code detected, expected 5 digit ZIP code, got 0
Error in reverse_zipcode(df$zipcode[i]) :
  Invalid ZIP code detected, expected 5 digit ZIP code, got 0
Error in reverse_zipcode(df$zipcode[i]) :
  Invalid ZIP code detected, expected 5 digit ZIP code, got 0
Error in reverse_zipcode(df$zipcode[i]) :
  Invalid ZIP code detected, expected 5 digit ZIP code, got 0
Error in reverse_zipcode(df$zipcode[i]) :
  Invalid ZIP code detected, expected 5 digit ZIP code, got 0
Error in reverse_zipcode(df$zipcode[i]) :
  Invalid ZIP code detected, expected 5 digit ZIP code, got 0
Error in reverse_zipcode(df$zipcode[i]) :
  Invalid ZIP code detected, expected 5 digit ZIP code, got 0
Error in reverse_zipcode(df$zipcode[i]) :
  Invalid ZIP code detected, expected 5 digit ZIP code, got 0
Error in reverse_zipcode(df$zipcode[i]) :
  Invalid ZIP code detected, expected 5 digit ZIP code, got 0
Error in reverse_zipcode(df$zipcode[i]) :
  Invalid ZIP code detected, expected 5 digit ZIP code, got 0
Error in reverse_zipcode(df$zipcode[i]) :
  Invalid ZIP code detected, expected 5 digit ZIP code, got 0
Error in reverse_zipcode(df$zipcode[i]) :
  Invalid ZIP code detected, expected 5 digit ZIP code, got 0
Error in reverse_zipcode(df$zipcode[i]) :
  Invalid ZIP code detected, expected 5 digit ZIP code, got 0
Error in reverse_zipcode(df$zipcode[i]) :
  Invalid ZIP code detected, expected 5 digit ZIP code, got 0
Error in reverse_zipcode(df$zipcode[i]) :
  Invalid ZIP code detected, expected 5 digit ZIP code, got 0
Error in reverse_zipcode(df$zipcode[i]) :
  Invalid ZIP code detected, expected 5 digit ZIP code, got 0
Error in reverse_zipcode(df$zipcode[i]) :
  Invalid ZIP code detected, expected 5 digit ZIP code, got 0
Error in reverse_zipcode(df$zipcode[i]) :
  Invalid ZIP code detected, expected 5 digit ZIP code, got 0
Error in reverse_zipcode(df$zipcode[i]) :
  Invalid ZIP code detected, expected 5 digit ZIP code, got 0
Error in reverse_zipcode(df$zipcode[i]) :
  Invalid ZIP code detected, expected 5 digit ZIP code, got 0
Error in reverse_zipcode(df$zipcode[i]) :
  Invalid ZIP code detected, expected 5 digit ZIP code, got 0
Error in reverse_zipcode(df$zipcode[i]) :
  Invalid ZIP code detected, expected 5 digit ZIP code, got 0
Error in reverse_zipcode(df$zipcode[i]) :
  Invalid ZIP code detected, expected 5 digit ZIP code, got 0
Error in reverse_zipcode(df$zipcode[i]) :
  Invalid ZIP code detected, expected 5 digit ZIP code, got 0
Error in reverse_zipcode(df$zipcode[i]) :
  Invalid ZIP code detected, expected 5 digit ZIP code, got 0
Error in reverse_zipcode(df$zipcode[i]) :
  Invalid ZIP code detected, expected 5 digit ZIP code, got 0
Error in reverse_zipcode(df$zipcode[i]) :
  Invalid ZIP code detected, expected 5 digit ZIP code, got 0
Error in reverse_zipcode(df$zipcode[i]) :
  Invalid ZIP code detected, expected 5 digit ZIP code, got 0
Error in reverse_zipcode(df$zipcode[i]) :
  Invalid ZIP code detected, expected 5 digit ZIP code, got 0
Error in reverse_zipcode(df$zipcode[i]) :
  Invalid ZIP code detected, expected 5 digit ZIP code, got 0
Error in reverse_zipcode(df$zipcode[i]) :
  Invalid ZIP code detected, expected 5 digit ZIP code, got 0
Error in reverse_zipcode(df$zipcode[i]) :
  Invalid ZIP code detected, expected 5 digit ZIP code, got 0
df %>%
mutate(
state = ifelse(nchar(state)>2, NA, state),
county = ifelse(grepl("(zip_char != 5)", county), NA, county)
) -> df
# Load county fips data, merge in df
data("fips_codes")
df <- df %>% left_join(fips_codes, by=c("county"="county", "state" = "state" ))
df %>%
mutate(
fips = paste(state_code, county_code, sep="")
) -> df
# Load ACS Data
state_pop <- get_acs(
geography = "state",
variables = "B01003_001",
year = 2020
)
state_pop %>%
mutate(
state_code = GEOID,
state_population = estimate
) -> state_pop
# Merge state population
df <- df %>% left_join(state_pop)
# County Data
county_pop <- get_acs(
geography = "county",
variables = c("B01003_001", "B01001B_001"),
output = "wide",
year = 2020
)
county_pop %>%
mutate(
county = NAME,
fips = GEOID,
county_population = B01003_001E,
county_black = B01001B_001E,
per_black_county = county_black/county_population
) -> county_pop
df <- df %>% left_join(county_pop %>%
select(fips, per_black_county, county_population,county_black ))
# Recode Group 6 Variables
df %>%
mutate(
support_ec_reform = g6_ec_reform - 4,
state_pop_quartile = case_when(
state_population <= quantile(state_pop$state_population)[2] ~ "Q1",
state_population > quantile(state_pop$state_population)[2] &
state_population < quantile(state_pop$state_population)[3] ~ "Q2",
state_population >
quantile(state_pop$state_population)[3] &
state_population < quantile(state_pop$state_population)[4] ~ "Q3",
state_population >
quantile(state_pop$state_population)[4] ~ "Q4"
),
from_big_state = ifelse(state_population > quantile(state_pop$state_population)[4],1,0)
) -> df
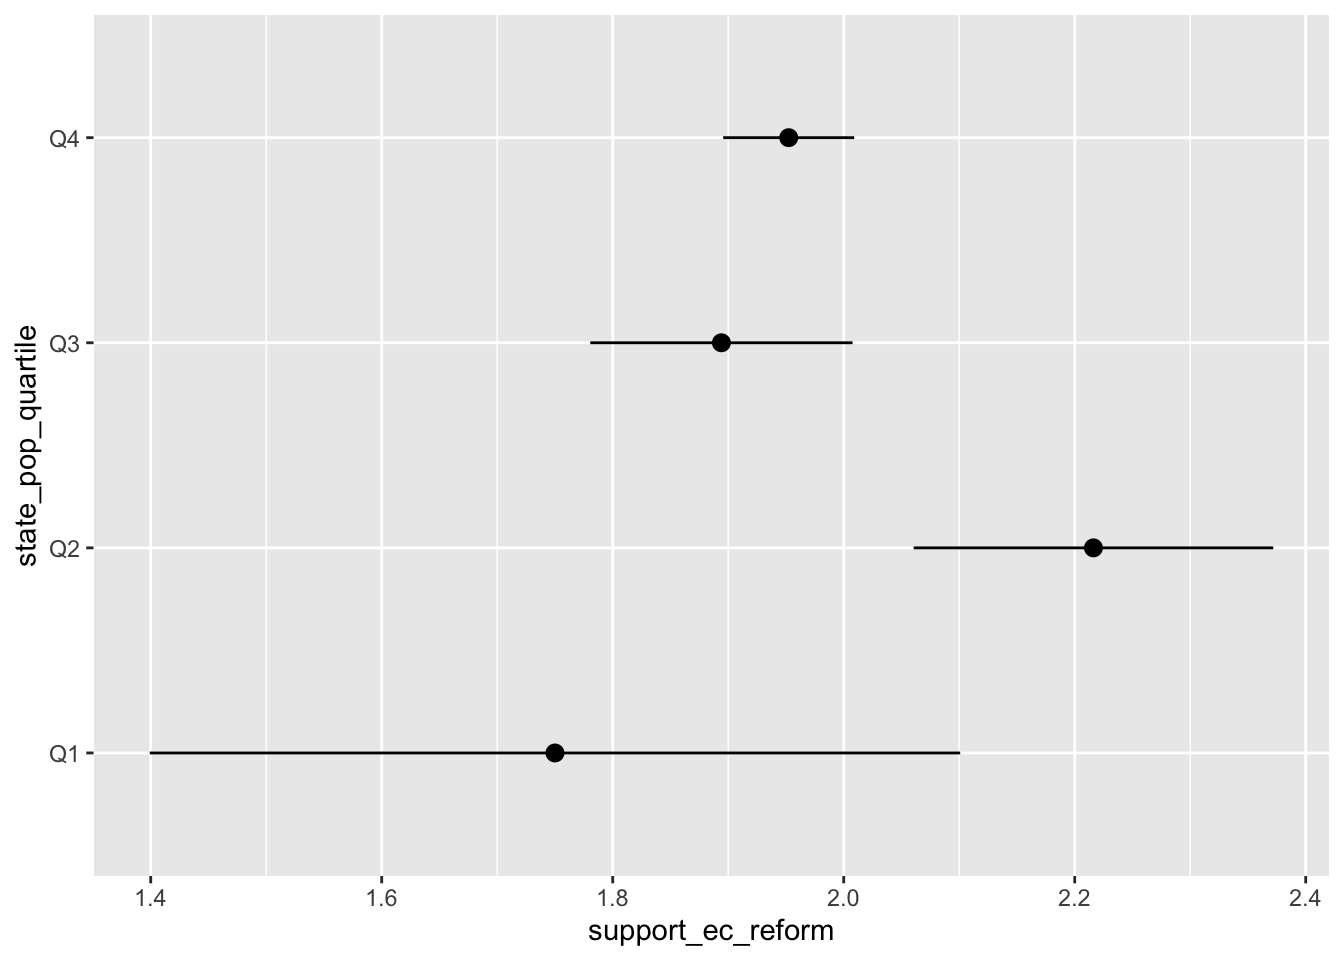
df %>%
ggplot(aes(state_pop_quartile, support_ec_reform)) +
stat_summary() +
coord_flip()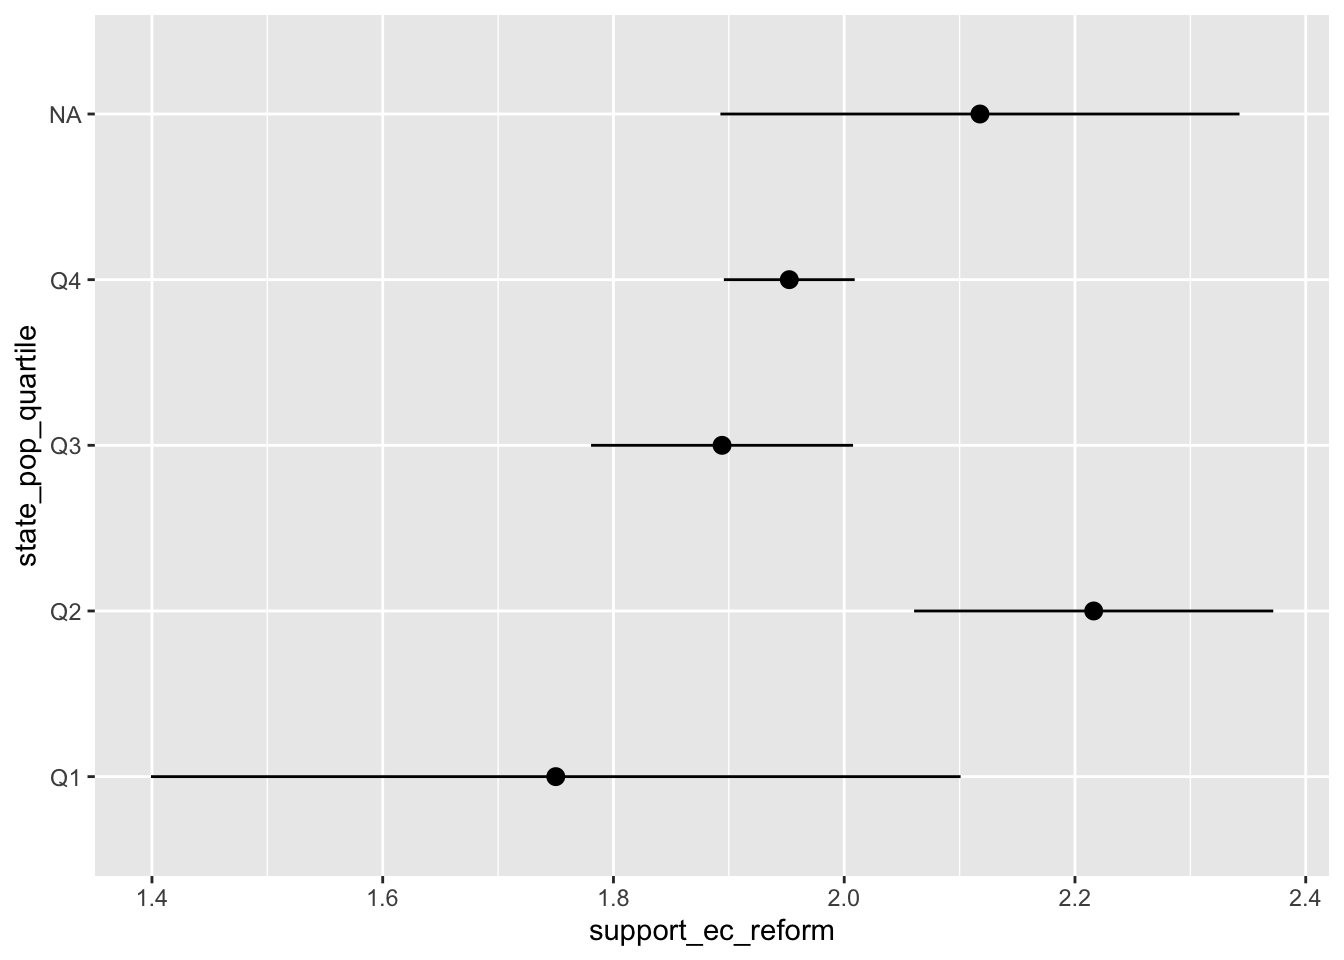
State Size and Support for EC Reform
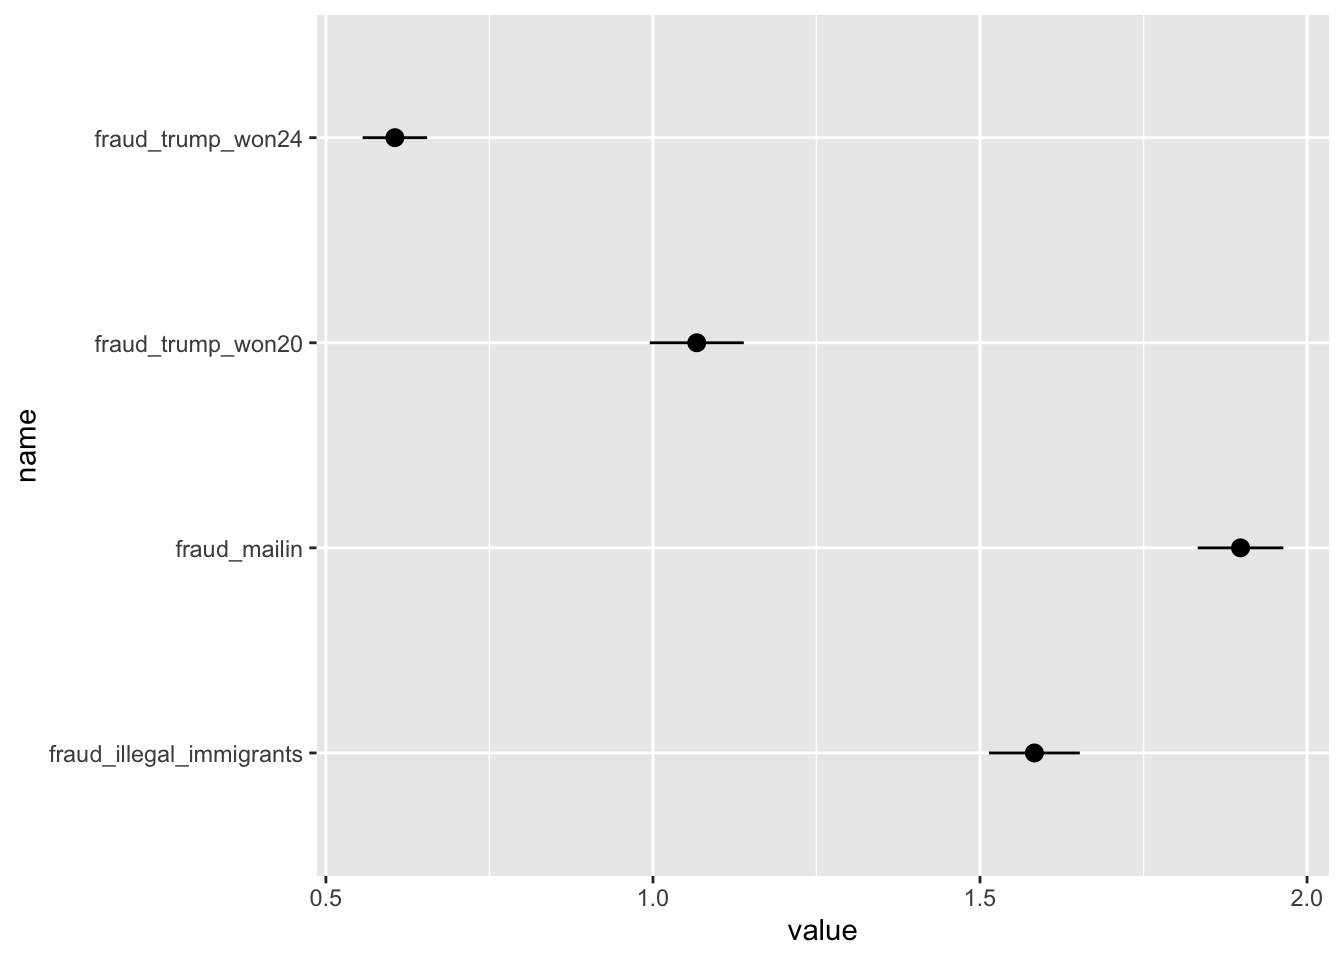
Fraud in Elections
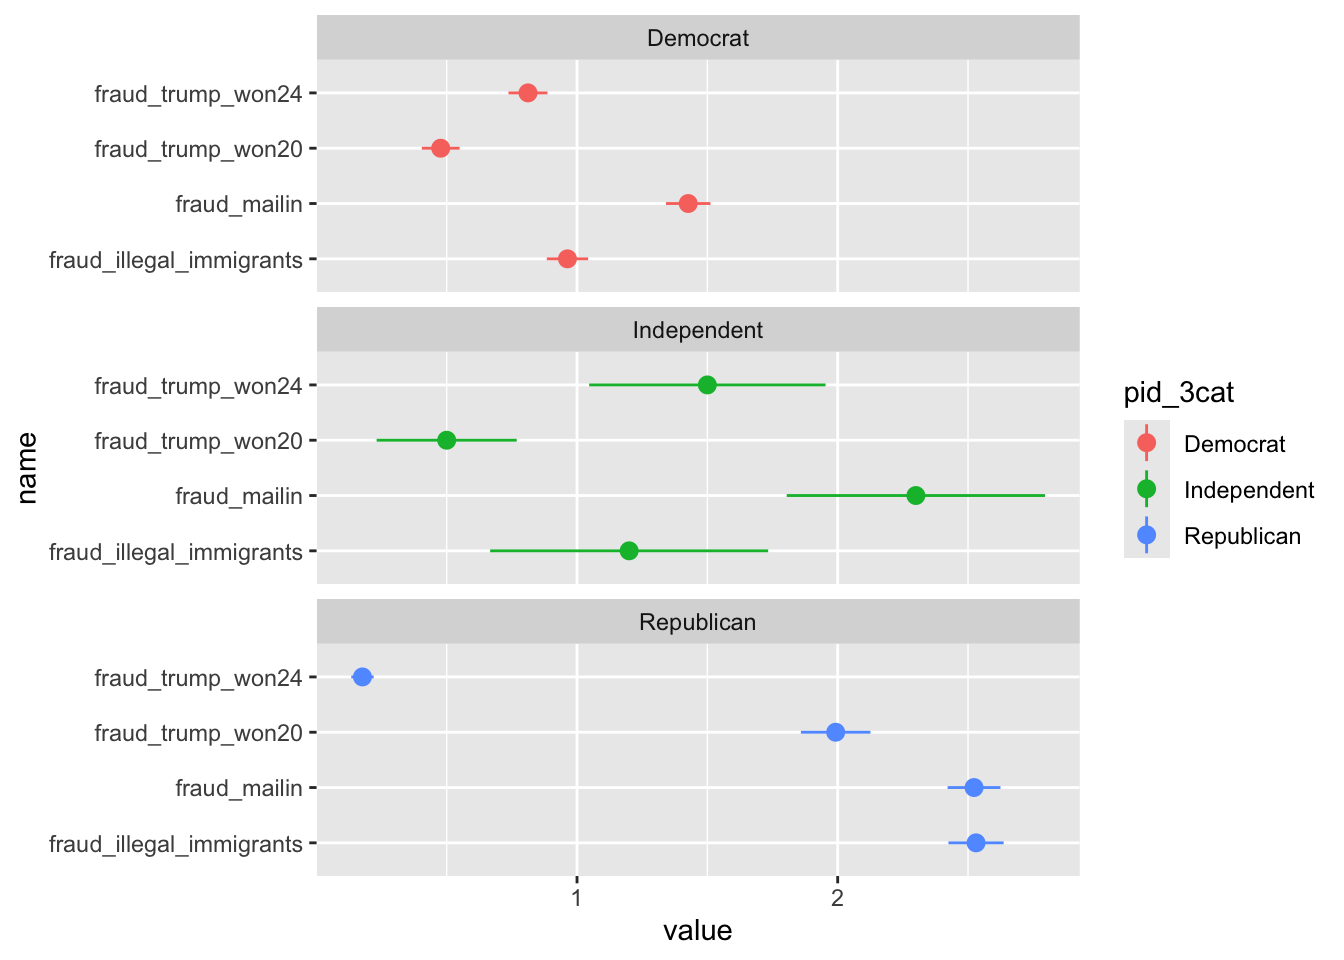
Fraud in Elections by Partisanship
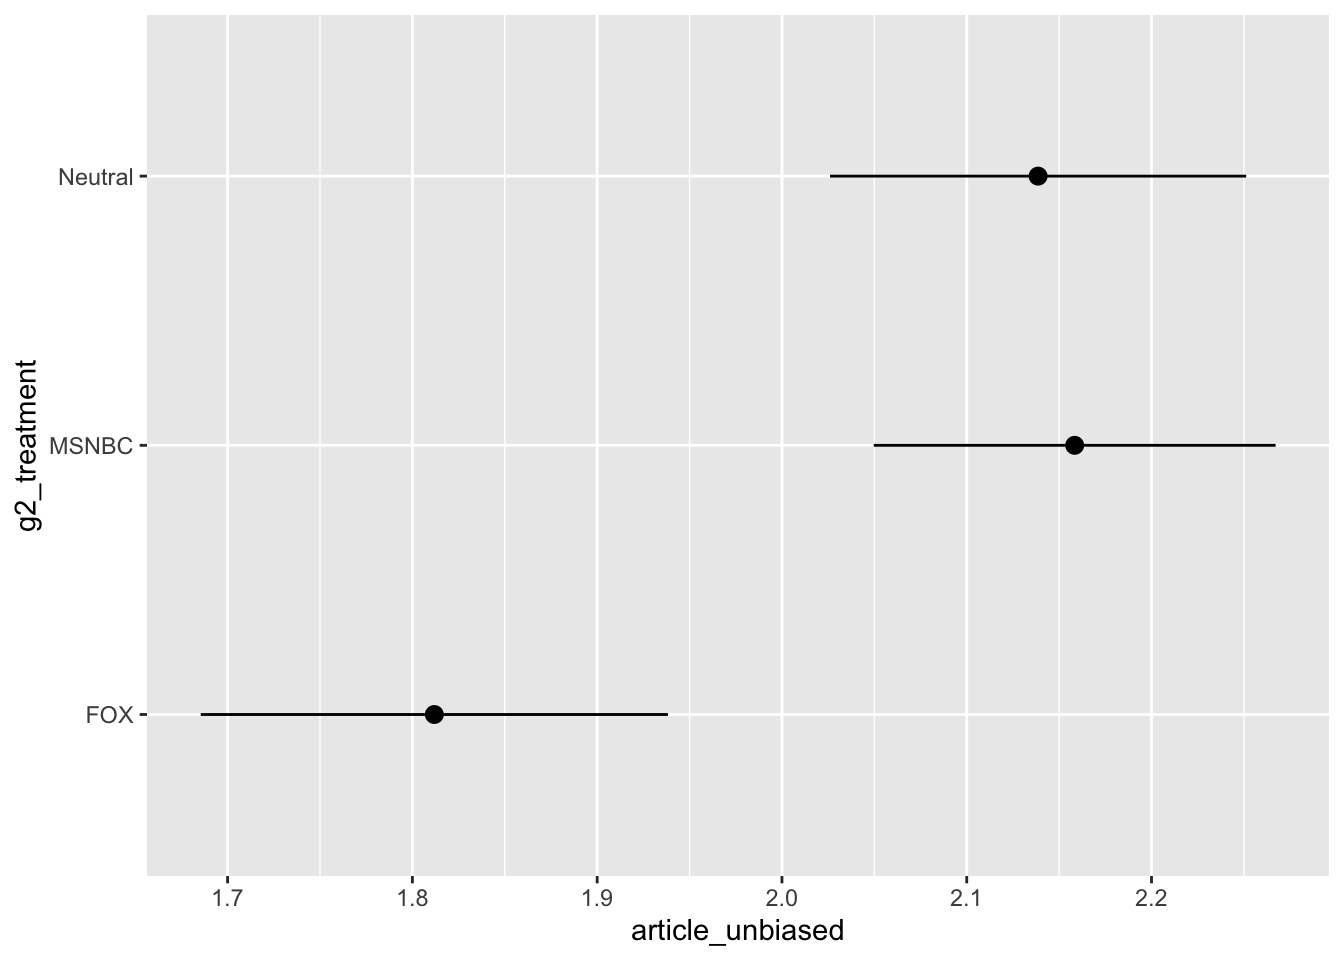
Biased of Article
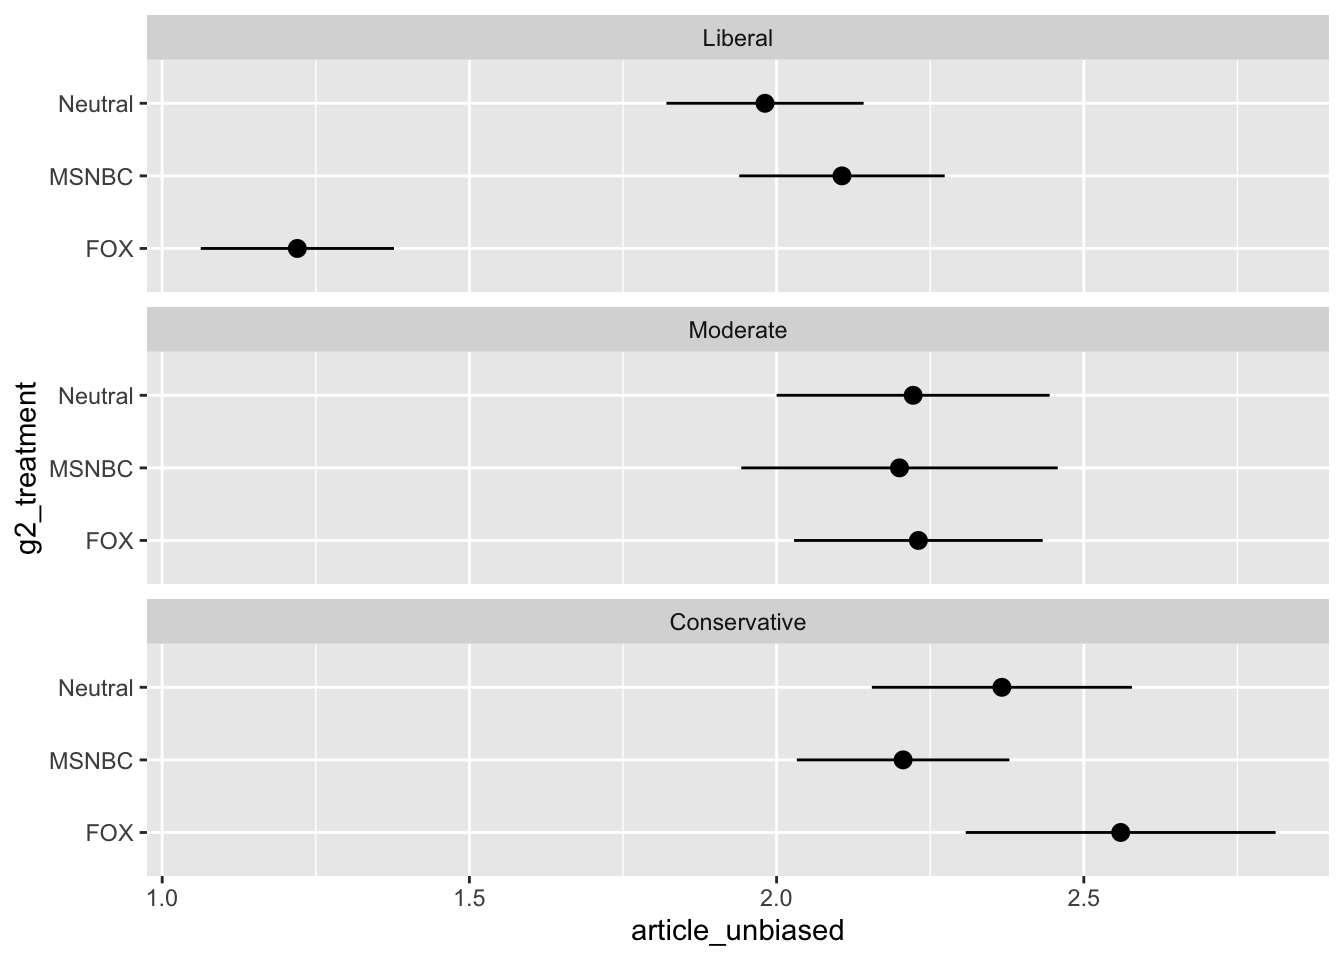
Biased of Article by Ideology
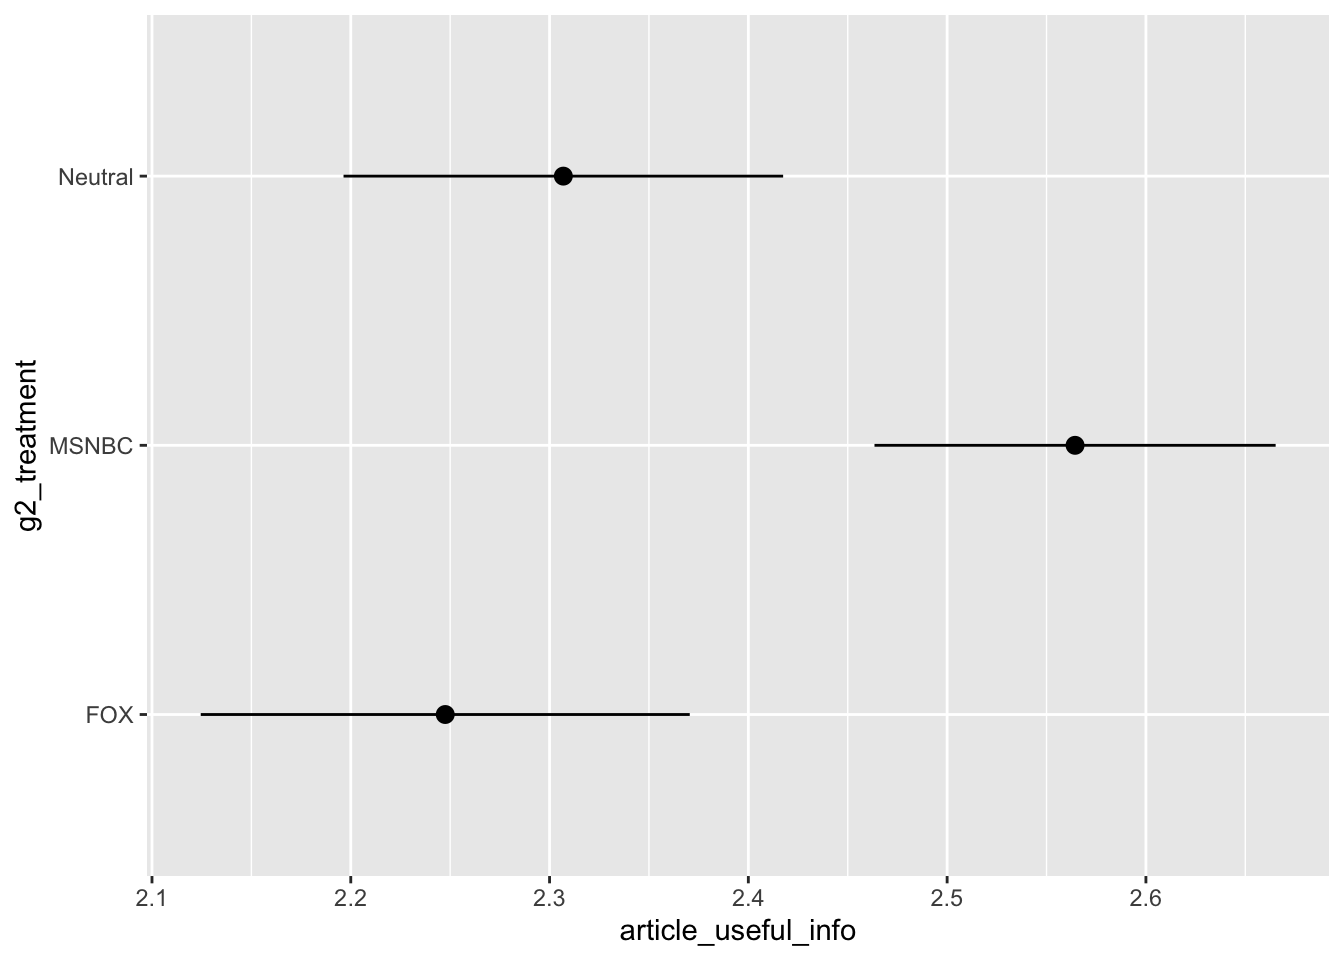
Useful Info
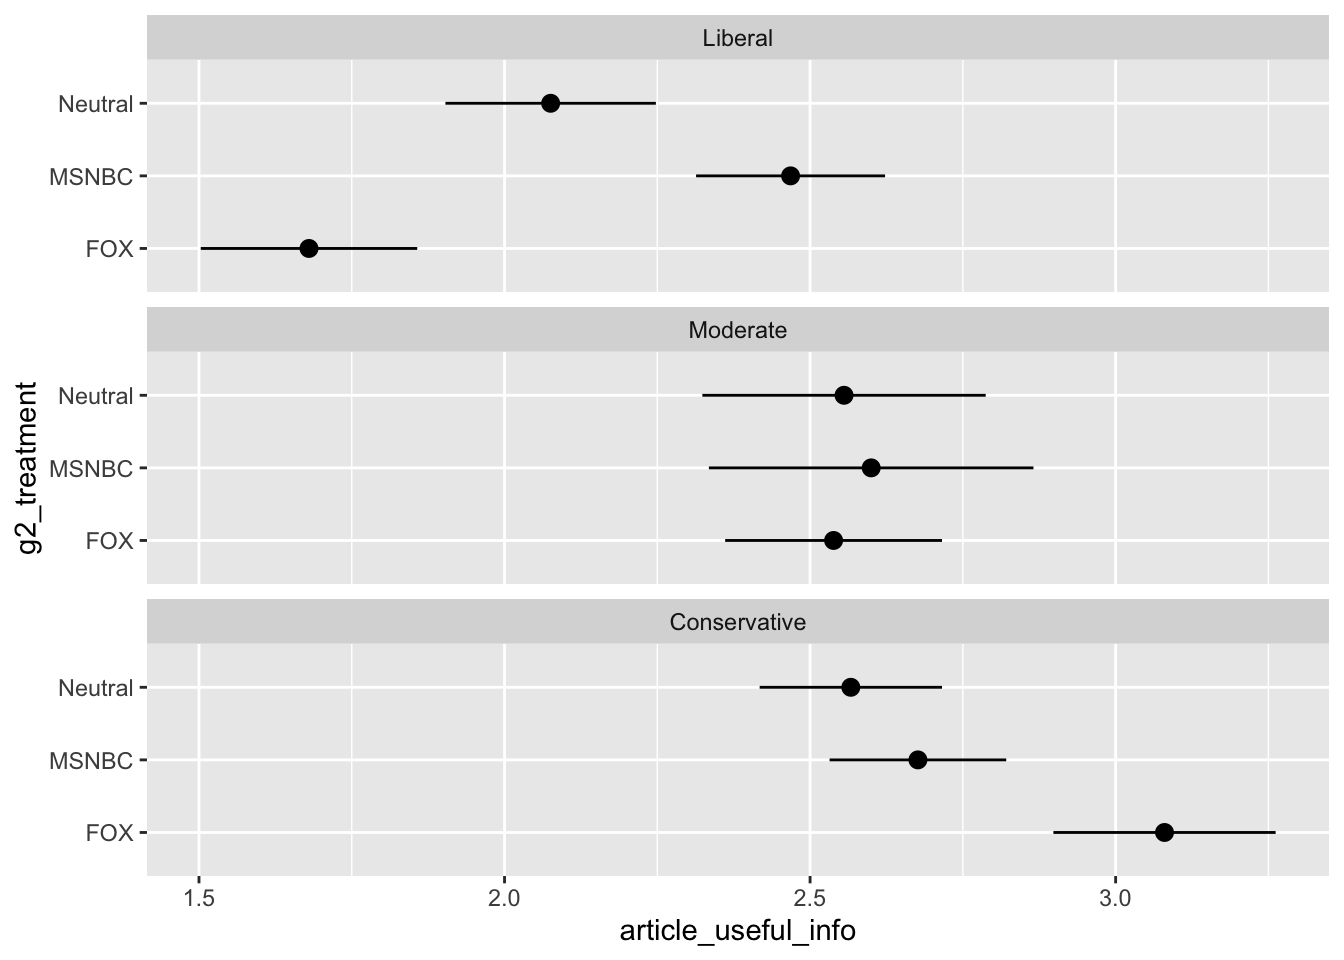
Useful Info by Ideology
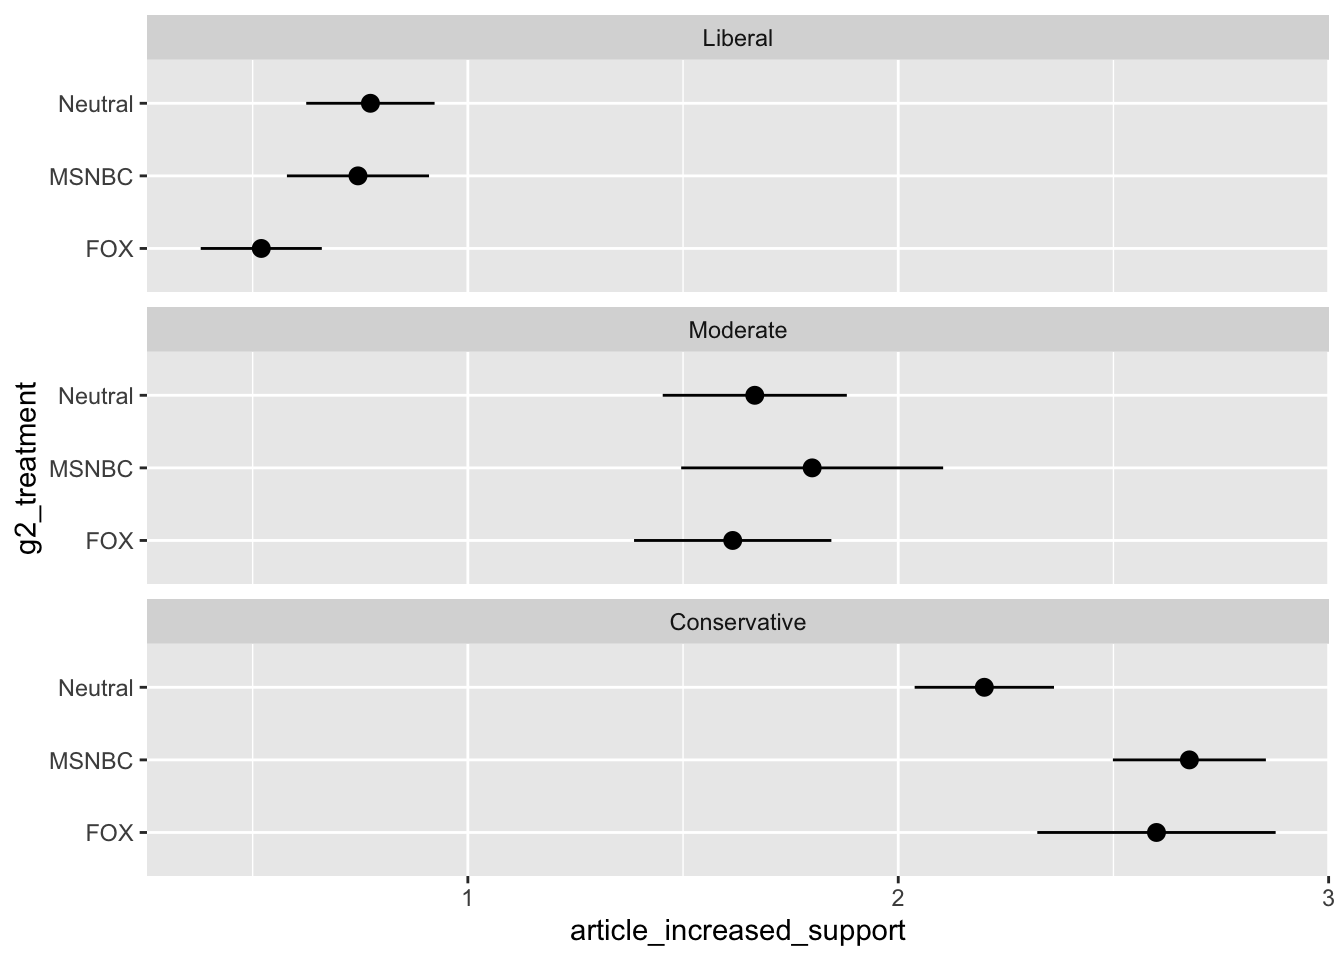
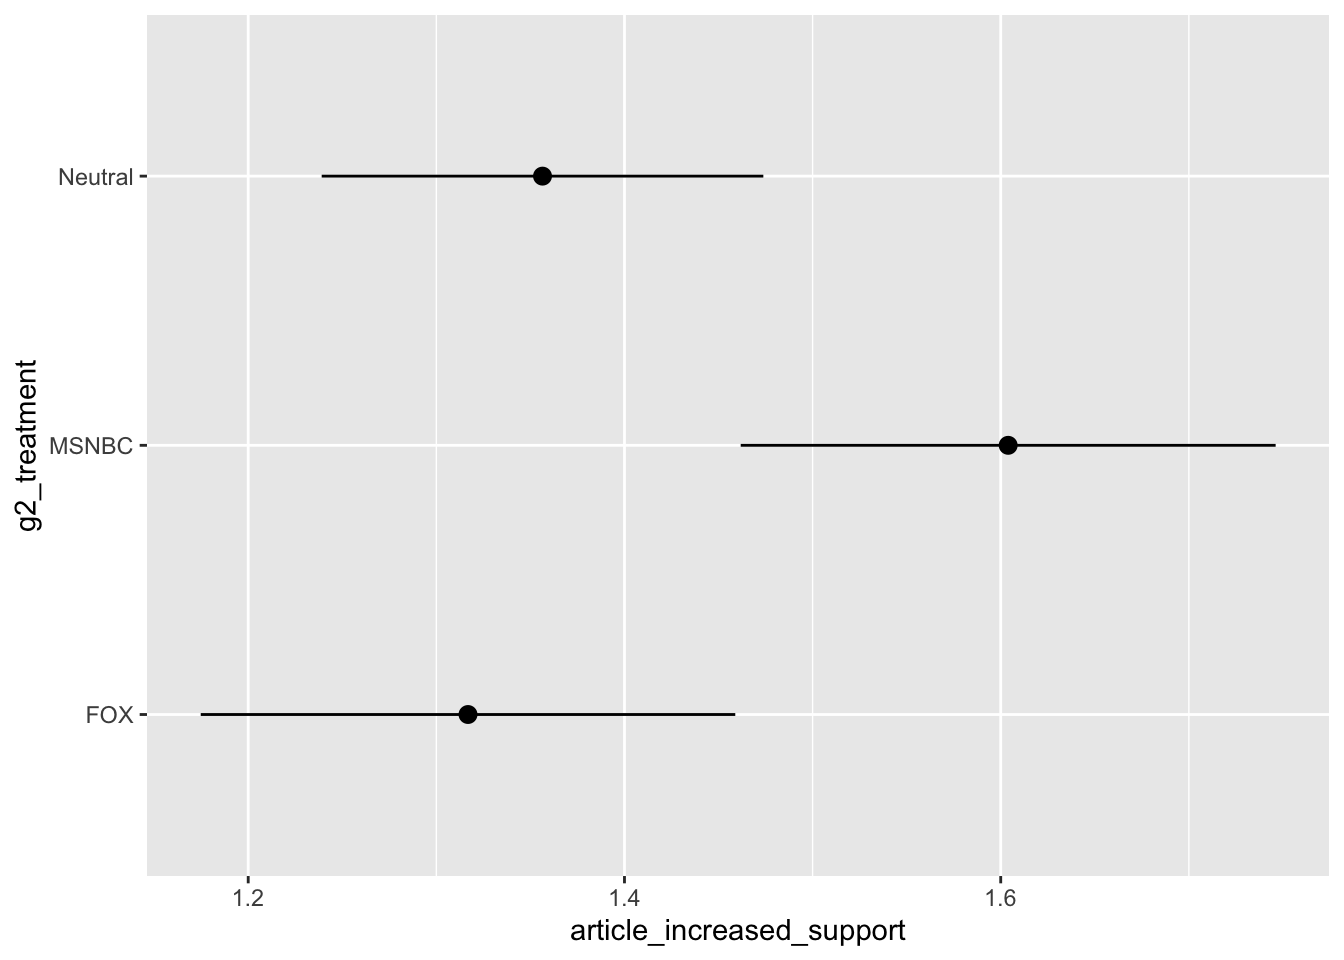
Increased Support
Increased Support by Ideology